- Mark as New
- Bookmark
- Subscribe
- Mute
- Subscribe to RSS Feed
- Permalink
- Report Inappropriate Content
This is referencing to support request 04706024, which I think was forgotten by Intel, and the support request itself, was with reference to a forum post on intel which was lost during the forum update recently.
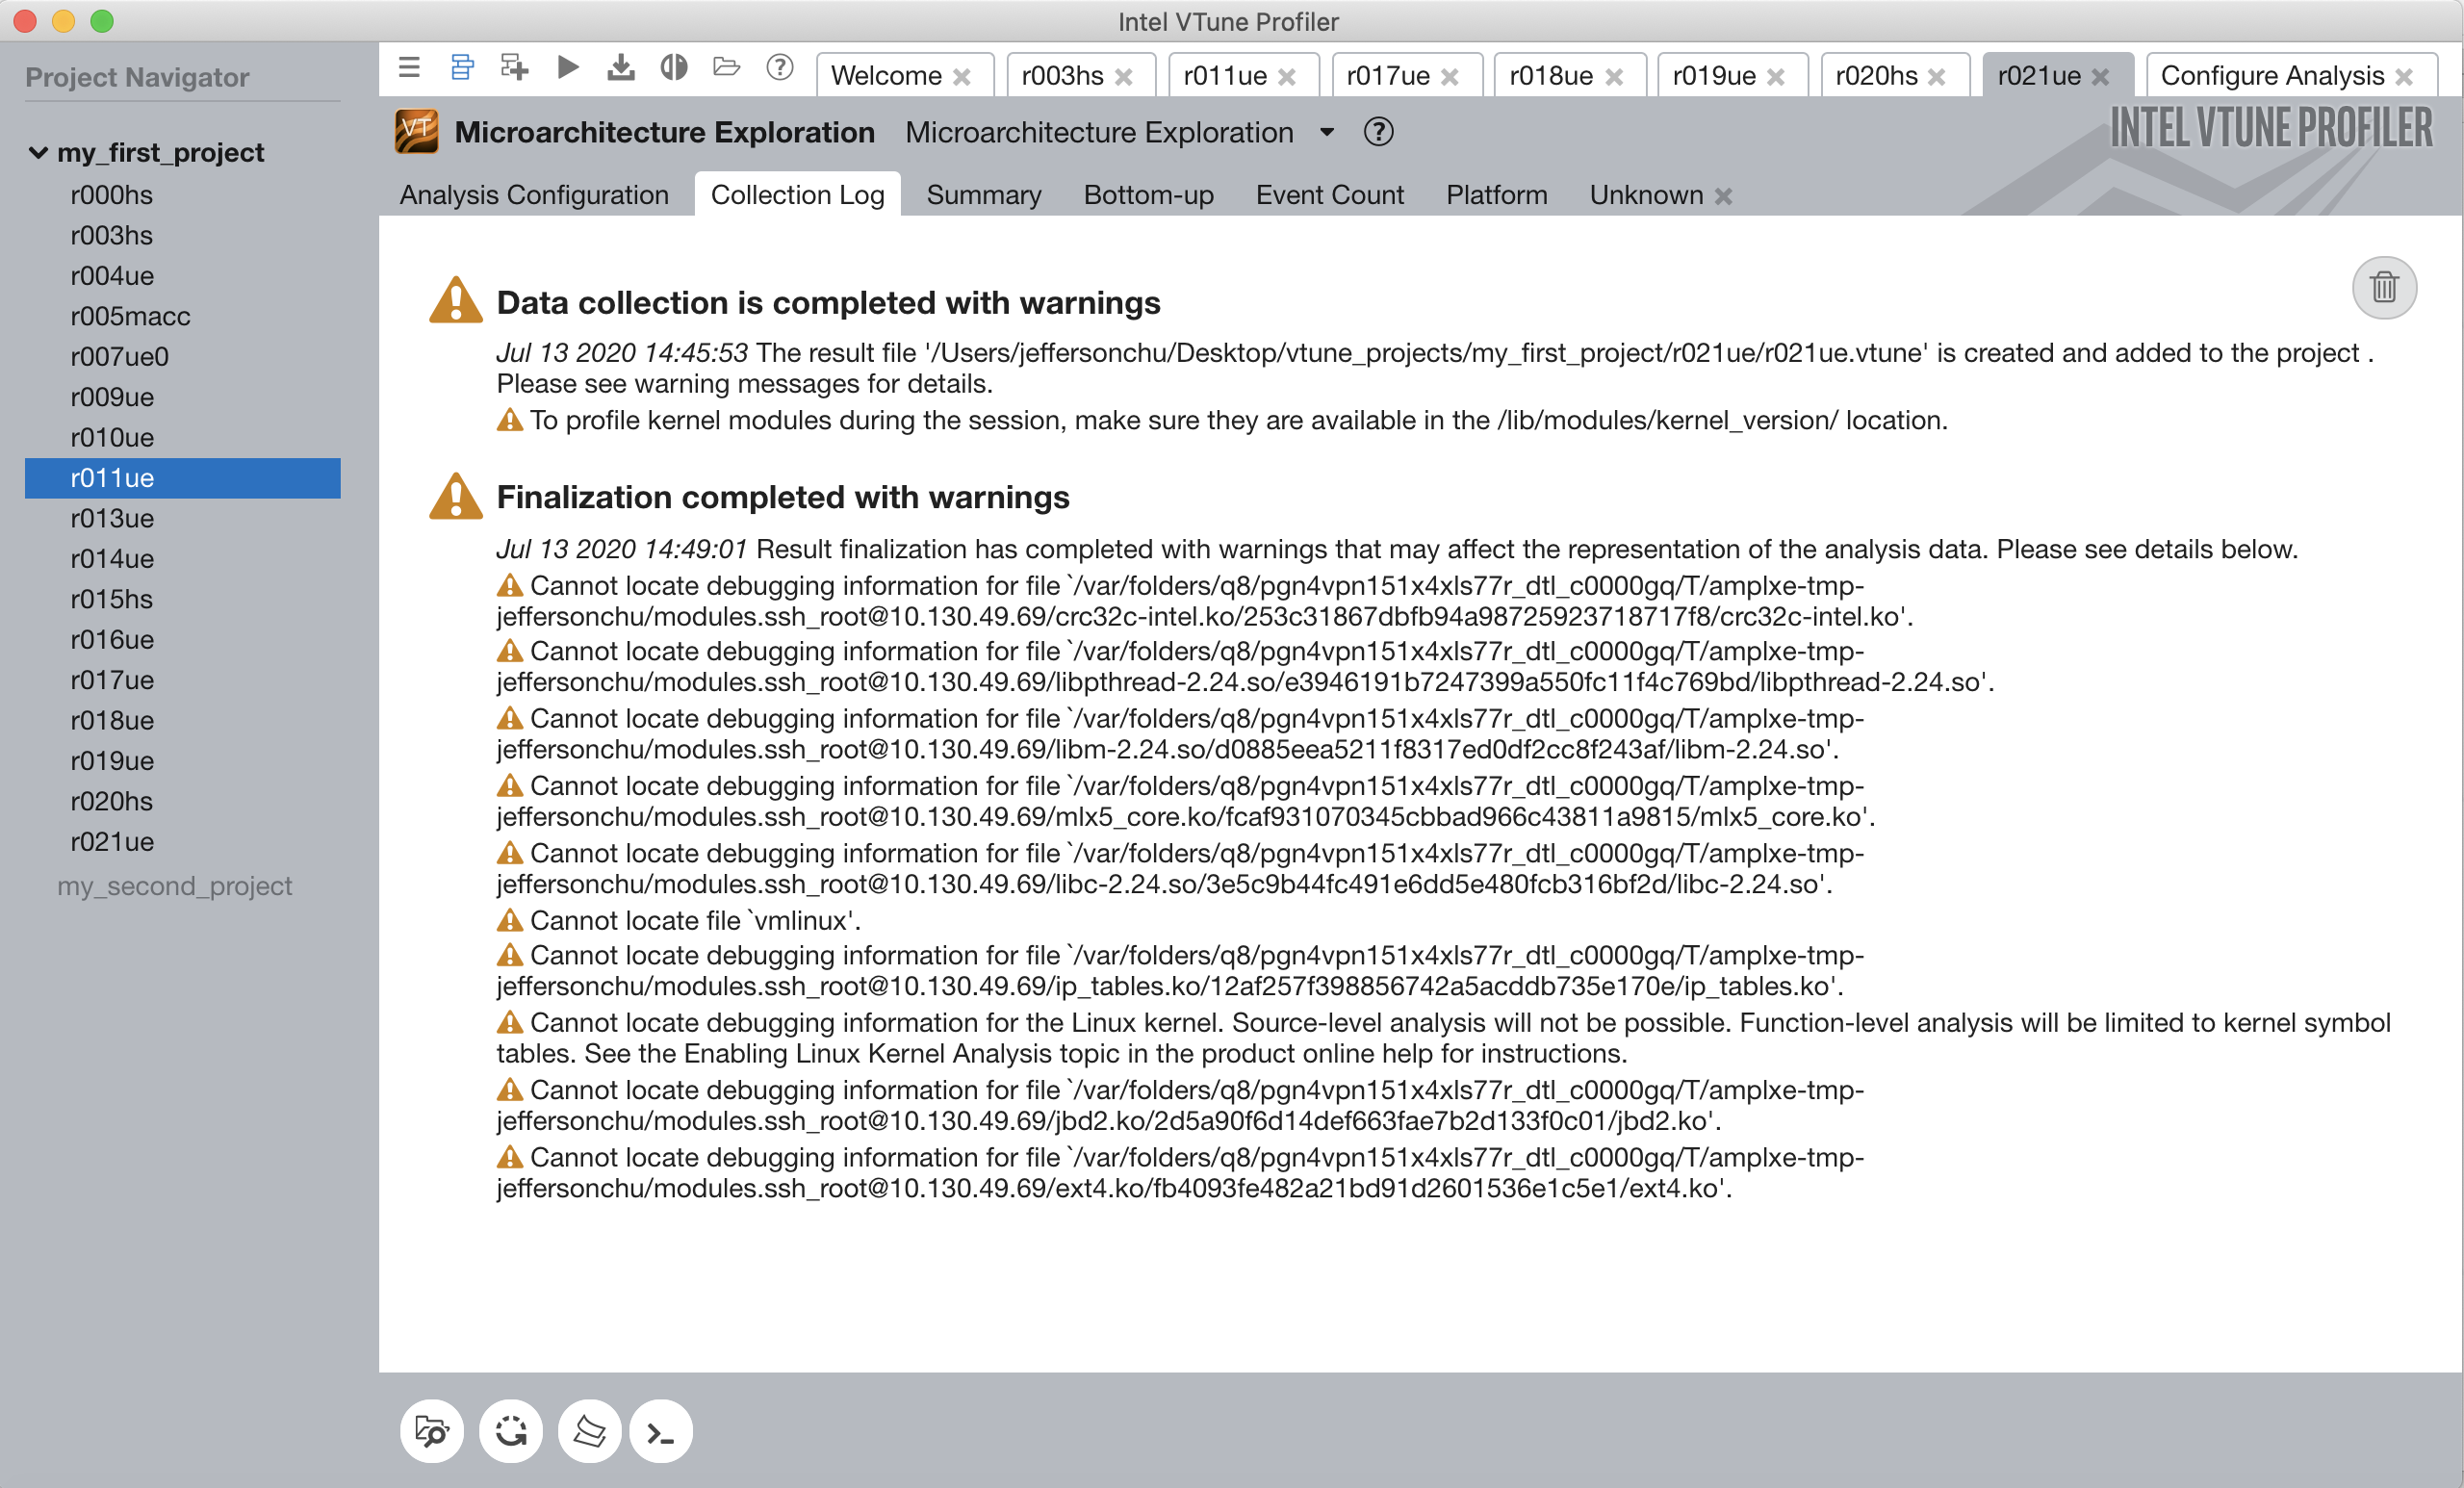
I will go straight to the point, I think I'm missing some debugging information which I suspect is critical for the microarchitecture analysis mode and I want to know how I can get them.
I have attached the screenshots below.
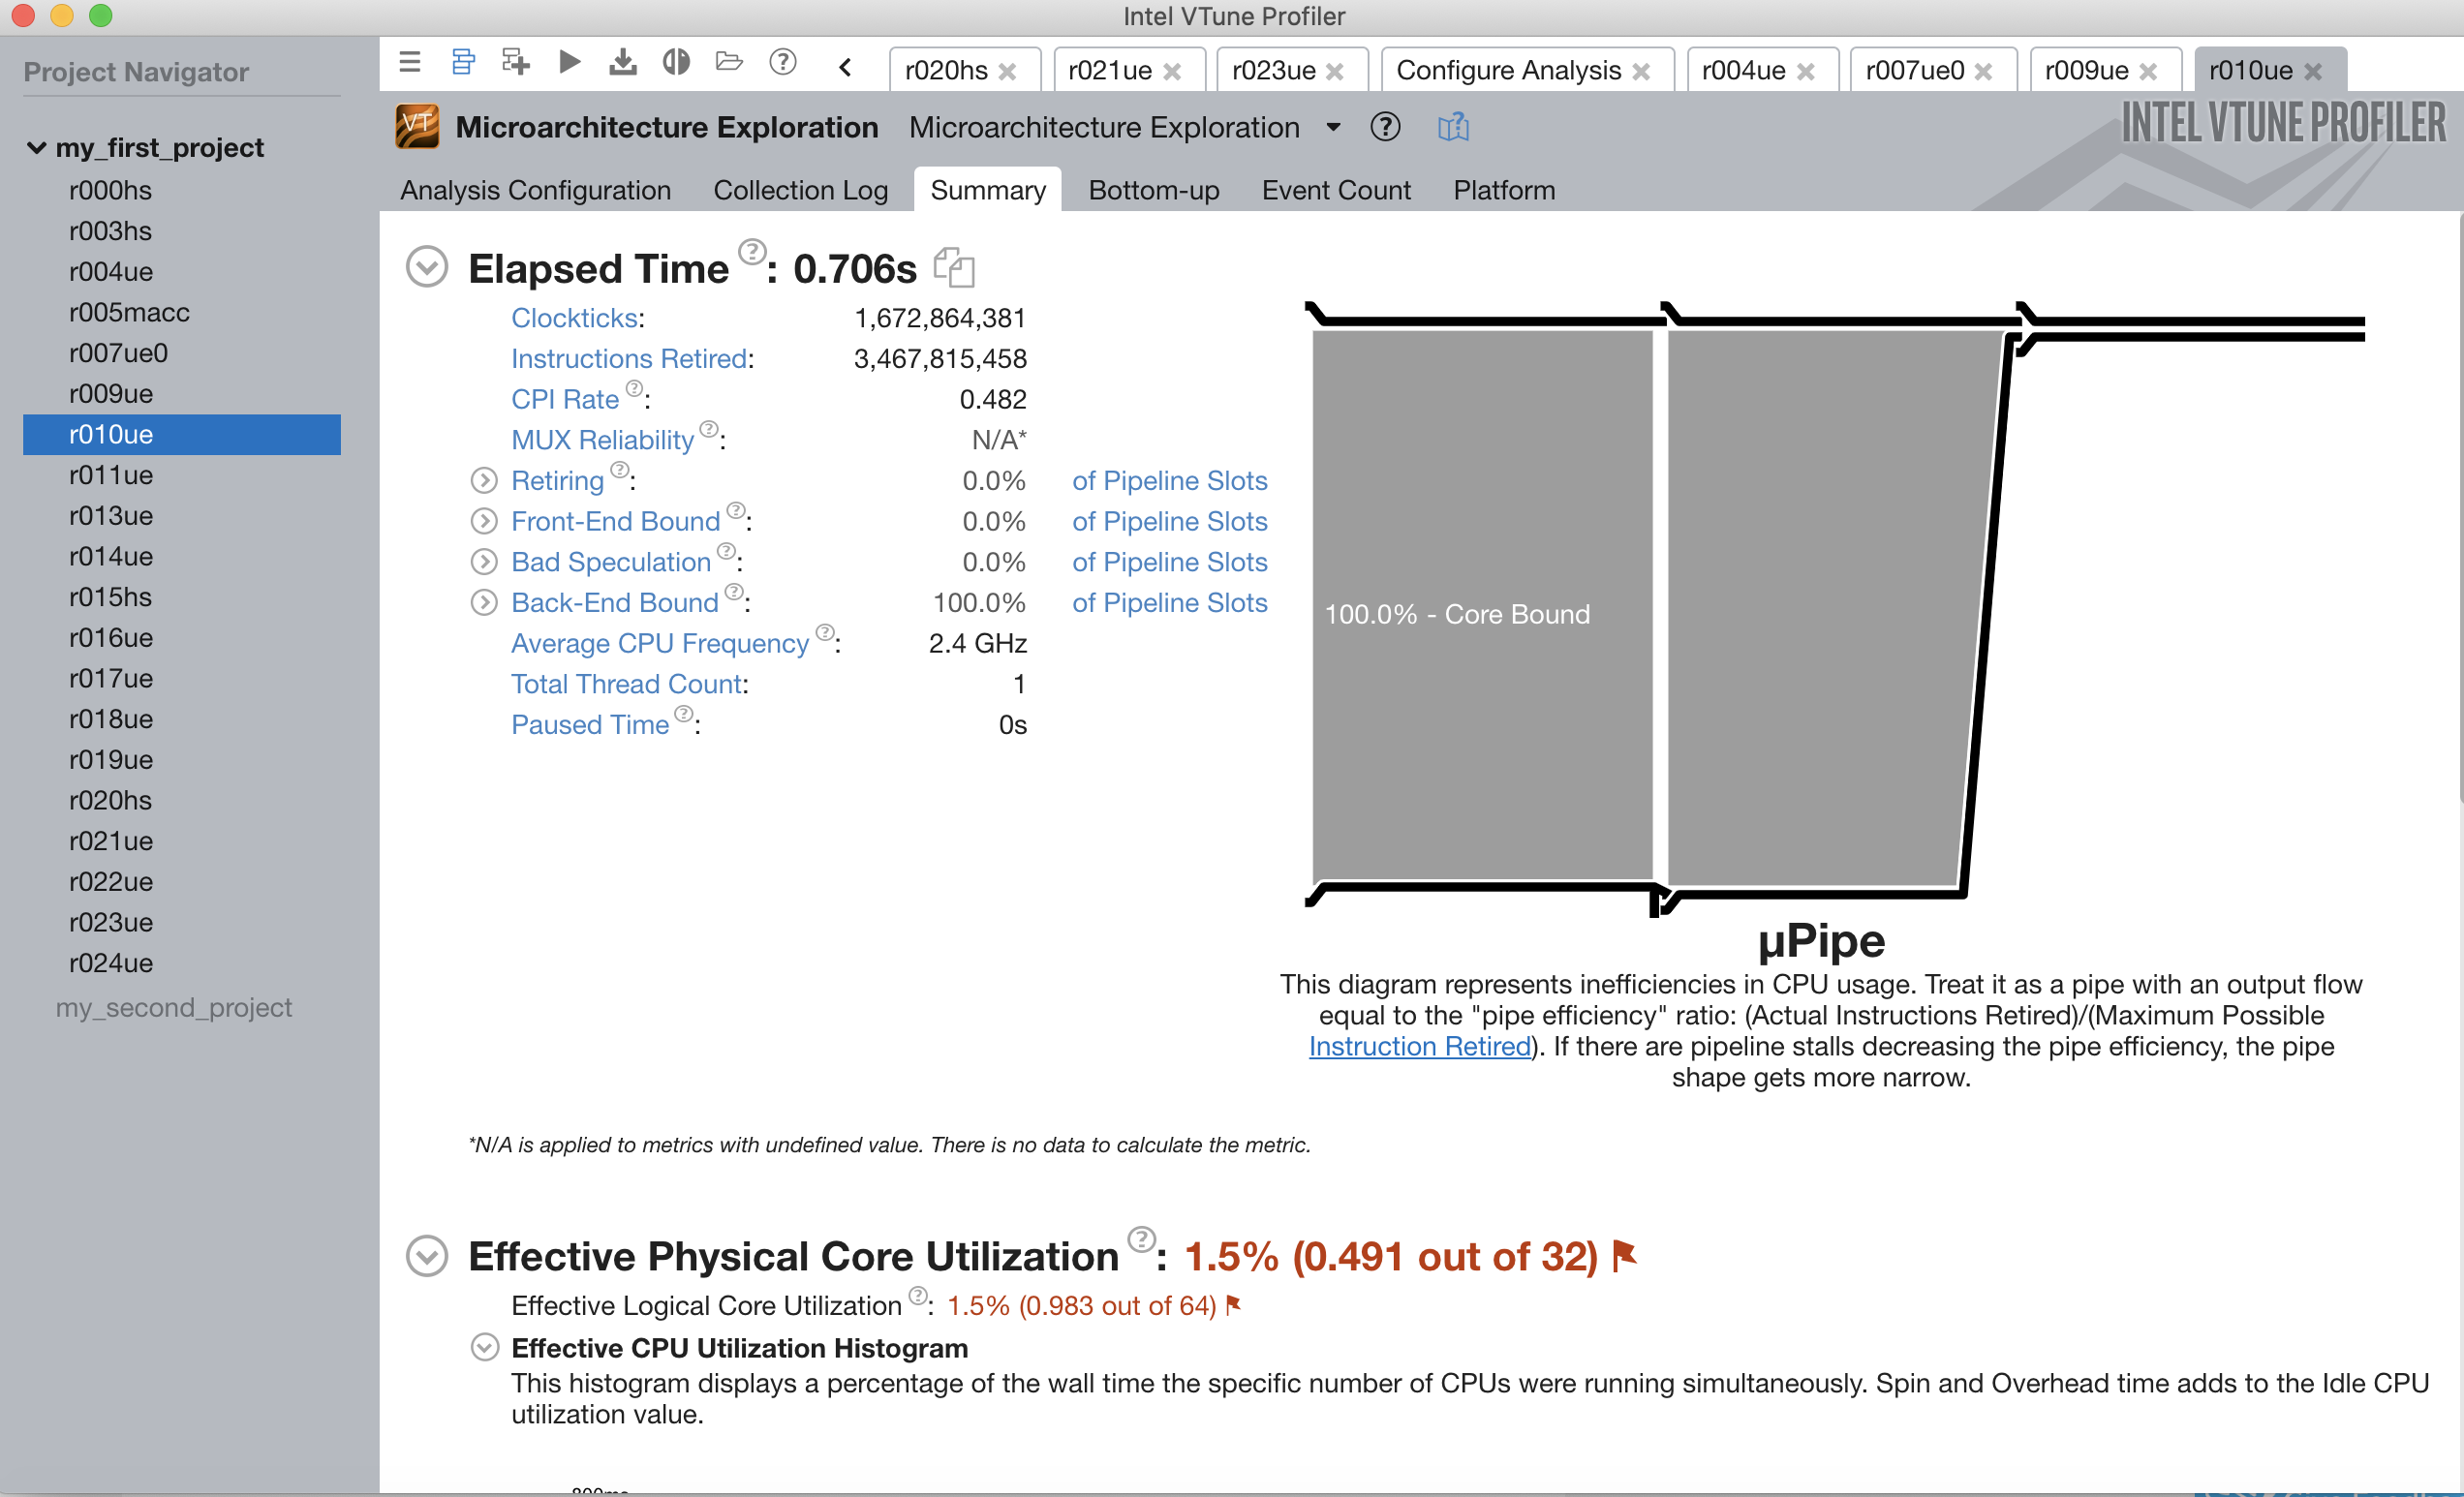
I wanted to use VTune to analyse if my code is back-end or front-end bound. But it is currently just showing 100% core bound regardless of what code I run. I am doing a remote analysis on a Debian/linux server from a MacBook. I also tried searching for the dbg packages online but couldn't find the ones that were stated missing by VTune (such as ld-2.24 and libc-2.24).
It would be of great help if anyone can tell me what is wrong and how to fix it. Thank you very much.
- Mark as New
- Bookmark
- Subscribe
- Mute
- Subscribe to RSS Feed
- Permalink
- Report Inappropriate Content
Thank you for the update!
However, I have managed to resolve the issue just now after reading through the Intel's cookbook.
Nonetheless, thank you so much for all the patience and assistance provided.
Link Copied
- Mark as New
- Bookmark
- Subscribe
- Mute
- Subscribe to RSS Feed
- Permalink
- Report Inappropriate Content
Hi chu__jefferson
We are extremely sorry for the inconvenience caused. We had addressed your previous forum thread the response failed to reach you due to form migration process.
In your previous query you seemed to be profiling a simple algorithm that had elapsed time less than 1 second. We tried profiling the code and could observe the 100% core bound issue for the code but when we increased the running time of the application using external loops this issue was resolved and the vtune report did not show 100% core bound anymore
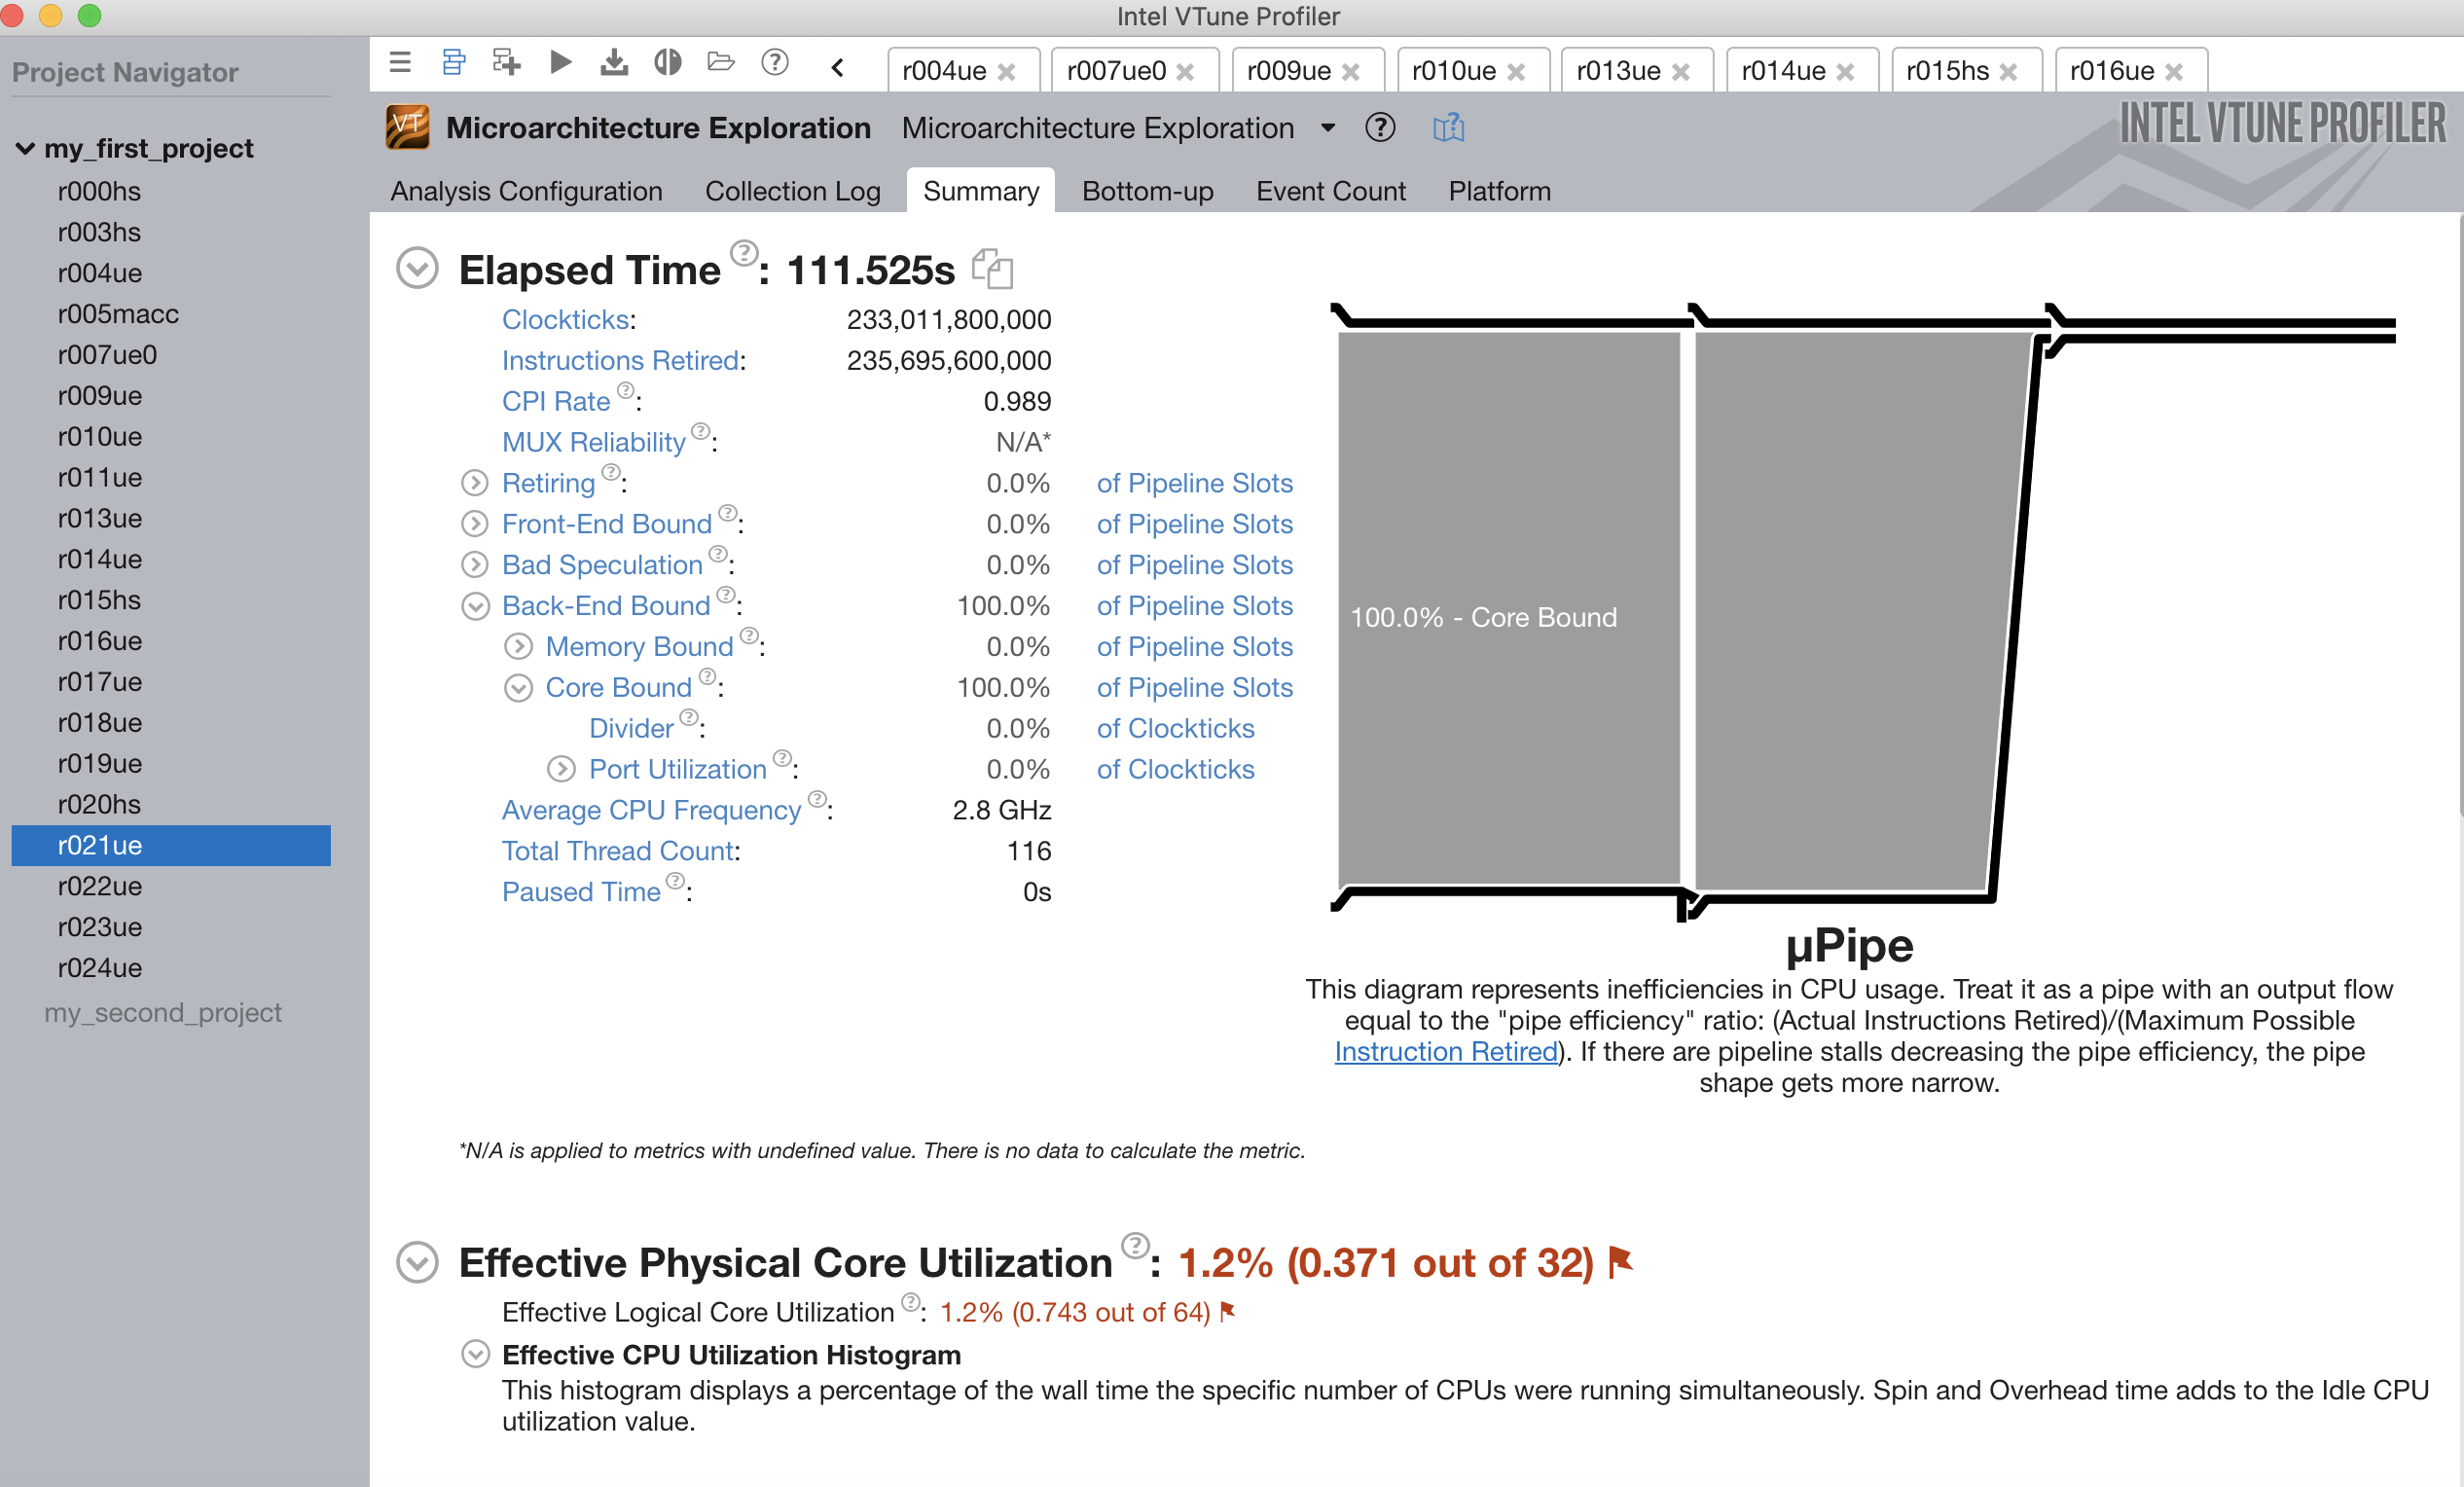
But in your current query I could observe the running time to be greater than 400 seconds. So are you profiling the same algorithm with external loops or is this a new application. If this is a new application would you be able to share with us the code that you are profiling. So we would be able to reproduce the issue from our end to help you further on this.
Thanks
Arun Jose
- Mark as New
- Bookmark
- Subscribe
- Mute
- Subscribe to RSS Feed
- Permalink
- Report Inappropriate Content
Hi,
Thank you for the quick response. I did made a response to the previous forum thread to the support issue. But here are the screenshots again, the 3 earlier timestamped screenshots were with the same algorithm previously, run at various times by adjusting the array size, ranging from few KBs to GBs.
Afterwards, I attached the profiler to the Clickhouse-server process, which is a database made by Yandex. I did not do any modification to the Clickhouse code and it was build directly from Github source. I was using the microarchitecture exploration mode, and also decrease the sampling interval from 5ms to 1ms to ensure sufficient sampling.
Personally, I feel that the issue has to do with the linux target I am targeting as suggested by the collection log, opposed to the code I am analysing.
- Mark as New
- Bookmark
- Subscribe
- Mute
- Subscribe to RSS Feed
- Permalink
- Report Inappropriate Content
Hi,
We are forwarding this case to SME. They will get back to you soon on the issue
Thanks
Arun Jose
- Mark as New
- Bookmark
- Subscribe
- Mute
- Subscribe to RSS Feed
- Permalink
- Report Inappropriate Content
Thank you for the update!
However, I have managed to resolve the issue just now after reading through the Intel's cookbook.
Nonetheless, thank you so much for all the patience and assistance provided.
- Mark as New
- Bookmark
- Subscribe
- Mute
- Subscribe to RSS Feed
- Permalink
- Report Inappropriate Content
Hi chu__jefferson,
Glad to know that your issue is resolved. We won't be monitoring this thread anymore. Kindly raise a new thread if you need further assistance.
Thanks
Arun
- Subscribe to RSS Feed
- Mark Topic as New
- Mark Topic as Read
- Float this Topic for Current User
- Bookmark
- Subscribe
- Printer Friendly Page