- Mark as New
- Bookmark
- Subscribe
- Mute
- Subscribe to RSS Feed
- Permalink
- Report Inappropriate Content
I have some questions for you:
- What exactly was abusive in my post you just deleted?
- Why didn't you ask me via email to edit/delete the part you consider abusive?
- Why didn't you edit/delete the abusive part instead of just zapping the whole post?
If Intel cannot stand some criticism without throwing its toys out of the pram, then I will suggest the medical imaging company I work for not to extend existing or purchase any new licenses for your software products. We need problems solved, not pushed under the carpet.
Finally, I am gravely offended by your way of handling this. I believe that I am a reasonable person, and you should have communicated with me if you had a problem with my post.
Link Copied
- Mark as New
- Bookmark
- Subscribe
- Mute
- Subscribe to RSS Feed
- Permalink
- Report Inappropriate Content
Some answers:
- Simply complaining about a product is not constructive and serves no real purpose. If you have suggestions on how it can be improved, please offer them. BTW, the comment about the performance of the VTune analyzer was well deserved. ;-)
- I am sorry, I'm still figuring out this forum software. I didn't even know that I could email you.
- If I had done that, how could I be sure you wouldn't just reply and add it back? I have no idea what kind of person you are. :-} From your post, I wasn't sure you were "reasonable".
- Mark as New
- Bookmark
- Subscribe
- Mute
- Subscribe to RSS Feed
- Permalink
- Report Inappropriate Content
Now isn't having a dialogue much better?
Simply complaining about a product is not constructive and serves no real purpose. If you have suggestions on how it can be improved, please offer them. BTW, the comment about the performance of the VTune analyzer was well deserved. ;-)
I have complained based on my experience with the product. Old versions of VTune (6 and older) were leaner and much more usefull. I have offered suggestions but you have reacted emotionally to my post and missed them. Never mind, I will list them here again.
- "Drill down" concept should be abandoned in my opinion, it is too cumbersome and it often leads you to the wrong spot. It sometimes even recurses endlessly leading you nowhere in particular.
- Integration with VS2005 is simply put — broken. Not only integration, but also the "Modify" option from VTune setup doesn't restore VS2005 functionality, I had to uninstall VTune completely to restore the ability to work in VS2005. This should be fixed quickly.
- As you admitted yourself VTune performance flaming was well deserved — you cannot sell terribly slow application with a purpose of performance analysis and improvement and expect people to believe it works. For me that rings all the alarm bells and I see rotating red lights with a bright yellow WARNING — POSSIBLE WASTE OF MONEY flashing sign in the middle.
- Latest VTune refuses to use symbol files (.pdb), even though they are in the same folder as the executable. Option to specify source code and symbol path must be burried somewhere because I couldn't find it and I am familiar with VTune since version 4.
- Older versions had the ability to suggest improved code scheduling for the selected CPU. That option seems not to exist anymore, and in my opinion that was single most usefull option VTune ever had. I'd like to have it back.
- VTune complains about code generated by Intel compiler for Core 2 family of CPUs as having some penalites. Who is right there? Compiler team or VTune team? I thought they work closely together, but it turns out that someone in your company doesn't have a clue about management.
I am sorry, I'm still figuring out this forum software. I didn't even know that I could email you. If I had done that, how could I be sure you wouldn't just reply and add it back? I have no idea what kind of person you are. :-} From your post, I wasn't sure you were "reasonable".
You could have checked my other posts to get a better picture.
In conclusion, I apologize for my rash removal of your post. It was mostly due to ignorance.
Apology accepted but next time please use other means of moderation first.
However, if you are still interested in providing sincere feedback on the product...
I am providing obligatory feedback via premier support for the products my company uses at the moment (Intel C++ Compiler for Windows).
Feedback for VTune you just got from me above is based solely on my good will because I have tested each new trial version over the years and I felt like I should speak out publicly because as a performance aware software engineer I do not like the form VTune is being shaped into.
That form is unfortunately best described as bloatware — not only in the terms of size a nd speed but also usability. If I just submitted this on premier support I doubt it would have adequate reach.
- Mark as New
- Bookmark
- Subscribe
- Mute
- Subscribe to RSS Feed
- Permalink
- Report Inappropriate Content
I would also like to let you know about our whatif.intel.com web site: "What if Intel started to share ideas and prototype software products as they were being developed? Intel is pleased to now offer advanced research items in the form of pre-production tools, add-ons, and prototypes online for you to try out." At that web site, we are presenting our Performance Tuning Utility (PTU) and gathering your feedback for future product direction. Since you are very keen on providing feedback, and are an advanced tuner, we would really appreciate your evaluation of PTU.
Finally, I would also like to respond to some of the items so that others are not misled.
- "Drill down" concept should be abandoned in my opinion, it is too cumbersome and it often leads you to the wrong spot. It sometimes even recurses endlessly leading you nowhere in particular.
- because sampling is system-wide (helps reduce overhead), there must be some mechanism to 'filter' the data. I'm sorry that you do not like the current implementation. Again, please check out PTU and see if it is better.
- Integration with VS2005 is simply put broken. Not only integration, but also the "Modify" option from VTune setup doesn't restore VS2005 functionality, I had to uninstall VTune completely to restore the ability to work in VS2005. This should be fixed quickly.
- It is fixed in Update 7, currently available on the Intel Registration Center to all registered customers, as well as to new evaluation customers.
- As you admitted yourself VTune performance flaming was well deserved you cannot sell terribly slow application with a purpose of performance analysis and improvement and expect people to believe it works. For me that rings all the alarm bells and I see rotating red lights with a bright yellow WARNING POSSIBLE WASTE OF MONEY flashing sign in the middle.
- The VTune analyzer is performing lots of data manipulations, including use of third-party database software from you-know-who. While I agree it is slow, I was not saying we can make it faster. Also, we offer a 30-day evaluation version for this very purpose. Basically, try it and if you don't like it, don't buy it.
- Latest VTune refuses to use symbol files (.pdb), even though they are in the same folder as the executable. Option to specify source code and symbol path must be burried somewhere because I couldn't find it and I am familiar with VTune since version 4.
- Currently, the VTune analyzer does not do a good job of reporting 'why' it does not load the symbols. My experience has been that this is usually due to a mismatch of the binary with the PDB. I have found the ChkMatch tool at www.debuginfo.com very useful for determining if the EXE/DLL and PDB match. If they do not, the VTune analyzer will NOT load the PDB. Note: Intel does not warranty the use of this tool in any way.
- Older versions had the ability to suggest improved code scheduling for the selected CPU. That option seems not to exist anymore, and in my opinion that was single most useful option VTune ever had. I'd like to have it back.
- I'm not sure which feature you are refer ring to here. The Tuning Assistant attempts to identify issues and provide advice. There used to be a feature called "Dynamic Analysis". You can see my reply to a similar query from another user regarding this old feature.
- VTune complains about code generated by Intel compiler for Core 2 family of CPUs as having some penalites. Who is right there? Compiler team or VTune team? I thought they work closely together, but it turns out that someone in your company doesn't have a clue about management.
- Depends on how you are using the VTune analyzer. Is the display set up for the correct processor (see context menu)? Which version of the VTune analyzer and compiler are you using? In general, the compiler is right. Also, we do not know of any problems with this VTune analyzer feature and would appreciate your issue submission at Intel Premier Support, since we would need to get exact steps and possible sampling data from you. Premier Support provides a secure mechanism to do that.
- Mark as New
- Bookmark
- Subscribe
- Mute
- Subscribe to RSS Feed
- Permalink
- Report Inappropriate Content
because sampling is system-wide (helps reduce overhead), there must be some mechanism to 'filter' the data. I'm sorry that you do not like the current implementation. Again, please check out PTU and see if it is better.
The whole idea is wrong. If you are profiling single executable why would you want to know how many time was spent in say win32k.sys?!?
Moreover, I had instances where I clicked on my executable in the list "drilling down" through whatnot and ended up looking at something other than my own code. I agree that filtering is needed but the user shouldn't be bothered with it. In other words, if I already picked an application to profile, why show me the footprint of an entire Windows kernel together with video drivers especially if the application doesn't even have a GUI?
Pardon the use of my analogy gun, but the current implementation is forcing you to travel from point A to point B using a crowded public bus with many stops, when the teleport has been invented and it is at your disposal.
It is fixed in Update 7, currently available on the Intel Registration Center to all registered customers, as well as to new evaluation customers.
Nice to hear that, not that the integration is that usefull anyway.
The VTune analyzer is performing lots of data manipulations, including use of third-party database software from you-know-who. While I agree it is slow, I was not saying we can make it faster. Also, we offer a 30-day evaluation version for this very purpose. Basically, try it and if you don't like it, don't buy it.
I am afraid you didn't understand me. I said it is a shame that VTune can't be used to optimize itself. In other words if Intel can't use it (and thus prove that it works) then what are our chances?
As for third-party library, why not use open source or roll your own which will do exactly what you need and faster?
Currently, the VTune analyzer does not do a good job of reporting 'why' it does not load the symbols. My experience has been that this is usually due to a mismatch of the binary with the PDB. I have found the ChkMatch tool at www.debuginfo.com very useful for determining if the EXE/DLL and PDB match. If they do not, the VTune analyzer will NOT load the PDB. Note: Intel does not warranty the use of this tool in any way.
Excuse me but I'll be blunt now — if Intel VTune can't cope with .pdb files produced by Intel Compiler then there is something fishy going on in Intel. Files are synced, I haven't used IPO or /LTCG, and I also built with /fixed:no as earlier versions of VTune required it but still no go.
I'm not sure which feature you are referring to here. The Tuning Assistant attempts to identify issues and provide advice. There used to be a feature called "Dynamic Analysis". You can see my reply to a similar query from another user regarding this old feature.
I am referring to the Assembly Coach feature which I believe it is no longer available:
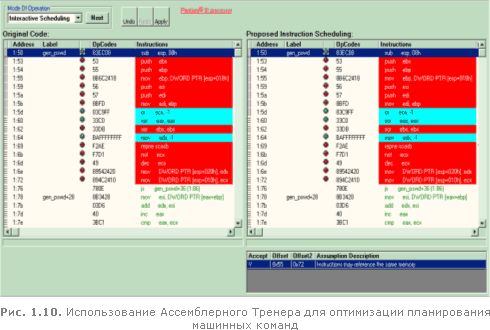
It was very usefull for fine-tuning hand-written assembler code. That is something I still often have to do but alas I can't keep track of all those latencies, throughputs, and execution units because instruction set has grown considerably not to mention CPU d ifferences.
Is the display set up for the correct processor (see context menu)?
Check
Which version of the VTune analyzer and compiler are you using?
Both latest
In general, the compiler is right. Also, we do not know of any problems with this VTune analyzer feature and would appreciate your issue submission at Intel Premier Support, since we would need to get exact steps and possible sampling data from you. Premier Support provides a secure mechanism to do that.
I am sorry but I am busy with my work. I listed the penalties which VTune showed for Intel C++ compiler generated code for Core 2 Duo (QxT) in the post which you have deleted. I have no intention to repeat the tests and retype it. You guys are getting paid for that kind of testing, not me. I have to earn for a living which is hard enough here where I live.
- Mark as New
- Bookmark
- Subscribe
- Mute
- Subscribe to RSS Feed
- Permalink
- Report Inappropriate Content
You still aren't understanding. To filter at data collection time would significantly increase overhead. Data is collected via an interrupt. Current implementation saves the execution context and continues, to minimize overhead. True that the analyzer could filter post-collection, however, we don't know what the user is profiling. A device driver developer DOES need to see everything.
Clarification: PDB files are produced by Microsoft linker.
I'm sorry, Igor, if the VTune analyzer is not meeting your expectations. Many customers are using it successfully. We are not forcing anyone to use it. The 30-day evaluation allows anyone the opportunity to try the product before buying. Again, I'm sorry you are frustrated. Please use any tool of your choice.
- Mark as New
- Bookmark
- Subscribe
- Mute
- Subscribe to RSS Feed
- Permalink
- Report Inappropriate Content
True that the analyzer could filter post-collection, however, we don't know what the user is profiling.
Are you kidding me?!?
If you don't know what we are profiling, why do we have to select an executable to run at all?!? Why not just randomly sample everything and let us "drill down" to what we need? I sincerely hope you weren't serious.
A device driver developer DOES need to see everything.
Then market the product correctly — towards device driver developers ONLY.
And what about the removed assembly coach?
- Mark as New
- Bookmark
- Subscribe
- Mute
- Subscribe to RSS Feed
- Permalink
- Report Inappropriate Content
Igor,
>>The whole idea is wrong. If you are profiling single executable why would you want to know how many time was spent in say win32k.sys?!?<<
Please excuse the interjection here. I am not a user of VTune (as my server is based on the "other" vendor's processor). With the performance analyzer that I use, I do find it valuable to know just how much time, and where,the O/S and otherapplicationsis sucking out of the available time to the application which I am attempting to fine tune. Of particular interest is the fact that 100% of all cores on the system is not available to the application. Knowing the overhead by non-application (operating system and perhaps other applications required by the application under test) is important as is the statistics for the application itself.
Perhaps the problem isn't what isbeing collected, but more of a problem of how it is presented. The tuner I use also shows complete system statistics, to get into my application-only statisticsis but a double click away. Hardly worth griping about.
Your other points are well taken. I've found your posts have been quite constructive - as in constructive criticism. The purpose of the forum is to discuss problems and to obtain solutions and/or address problems to the vendor in hope of obtaining revisions that result in a solution. Providing the problem information to Premier Support is but one venue to the user, an open forum is another. Excepting for blatent flame or shameless plug of product or service, the forum should be open to discussion between user and vendor as well as between user and user.
Keep up your good posts Igor.
Jim Dempsey
- Mark as New
- Bookmark
- Subscribe
- Mute
- Subscribe to RSS Feed
- Permalink
- Report Inappropriate Content
I do find it valuable to know just how much time, and where, the O/S and other applications is sucking out of the available time to the application which I am attempting to fine tune.
I never said that information isn't valuable. However, it is of much less value than being able to pinpoint the hotspot in one mouse click.
Moreover, when you start seeing a lot of CPU time used outside of your program, that usually means your code is wasting time waiting for paging, I/O, or your thread synchronisation is poor so you again need to turn back to your own code.
Granted, there are certain situations when by seeing such data you can realize that particular set of system calls is inefficient, but it happens rarely enough that the system profiling data need not to be pushed in your face as soon you start profiling. In other words — in 99% of cases it is your code at fault.
Perhaps the problem isn't what is being collected, but more of a problem of how it is presented.
Yes, that is exactly the problem. Presentation is cumbersome, and you definitely need a lot more than one click to see any relevant data.
Your other points are well taken. I've found your posts have been quite constructive - as in constructive criticism.
Thanks Jim. Unfortunately, seems that some people do not share your views. They ask for more constructive criticism and when I provide some I can't seem to get any answers.
For example, I am still waiting for an answer as to why assembly coach was removed from VTune.
- Mark as New
- Bookmark
- Subscribe
- Mute
- Subscribe to RSS Feed
- Permalink
- Report Inappropriate Content
Second, assembly coach. Actually, I think this is still available. Drill down to source view, then switch to assembly view. Now, select a instruction and press F8. However, advice is only offered for instructions that are flagged in the disassembly view. Also, you can double-click on an instruction to open up the reference page for that instruction.
Next, "we don't know what you are profiling." Igor, I'm sorry, but you have your blinders on. There are many types of developers, that is, developing many types of software. The VTune analyzer is flexible enough to be used by all. I'm sorry that it doesn't make what you are doing as easy as you would like. Perhaps there is a simpler product that you could use?
Finally, we actually do appreciate your feedback. The forums are just not the best way to provide it; Premier is better. Also, we are in the middle of the next major revision of the VTune analyzer and if you are interested, perhaps we could engage you in the review process. For those interested, please submit an issue to Premier Support providing all your contact information.
- Mark as New
- Bookmark
- Subscribe
- Mute
- Subscribe to RSS Feed
- Permalink
- Report Inappropriate Content
First, a correction. The forums are not a venue for communicating with the vendor. The forums are "community supported." Intel does not publish an SLA, that is, we don't gaurantee a response to anything posted here. If you want a gauranteed, submit your issue to Intel Premier Support.
I am aware of that but since we were already in the middle of a discussion there was no reason not to expect an answer. After all, you work for Intel and you are probably paid to help people find the right answers, right?
However, advice is only offered for instructions that are flagged in the disassembly view.
That is not the same thing, assembly coach offered to rearrange the instruction order to best suit the target CPU.
Also, you can double-click on an instruction to open up the reference page for that instruction.
I have copied said CHM file and I am using it out of VTune often so I know about it but that still isn't assembly coach. Neither is the IA32 Optimization Reference Manual which I read several times already.
Perhaps there is a simpler product that you could use?
Perhaps... the one where you can see the hotspots in the executable you are profiling and nothing else. Perhaps even VTune could have a "dumbed down" mode where it would limit sampling to the particular application and its threads?
Also, we are in the middle of the next major revision of the VTune analyzer
If you can provide me with the list of new features/improvements beforehand I might be interested.
- Mark as New
- Bookmark
- Subscribe
- Mute
- Subscribe to RSS Feed
- Permalink
- Report Inappropriate Content
I'm sure you understand that I can't pre-announce features and improvements. Thanks, anyway, though.
- Mark as New
- Bookmark
- Subscribe
- Mute
- Subscribe to RSS Feed
- Permalink
- Report Inappropriate Content
Igor,
As an additional tool for your toolbox I suggest that you consider downloading AMD's CodeAnalyst. It won't do event sampling on Intel processors, but it will do timer based sampling. It does default to show the System Data with System Graph and Processes on alternate Tabs. The application under test is almost always on top. A double click on that opens the Application Data. You can sort by whatever you are interested in, typicaly number of samples. Navigating the hot spots is quite easy even down to the dissassembly code. CA seems to do a good job at keeping the source code in line with the sample data and dissassembly code. I would like to suggest that Intel take a look at the user interface to get some ideas for VTune.
Once you finish with general tuning via statistical timer based sampling then you can switch over to using VTune.
The only gripes I have with CA is 1) it doesn't perform event sampling on Intel processors, 2) if you perform sizable amounts of edit on the source code then the old statistics files won't align with the new code.
Jim Dempsey
- Mark as New
- Bookmark
- Subscribe
- Mute
- Subscribe to RSS Feed
- Permalink
- Report Inappropriate Content
I'm not familiar with what you are calling assembly coach, then.
I understand. As I said, you could select a block of assembler code (say a loop) and VTune's assembly coach would then reschedule the instructions optimally for target CPU. It was very usefull for hand-written assembler functions.
I'm sure you understand that I can't pre-announce features and improvements. Thanks, anyway, though.
I was thinking of you sending me an email with some details, I wasn't asking for a public announcement. Let me know if that is possible.
As an additional tool for your toolbox I suggest that you consider downloading AMD's CodeAnalyst.
Agner Fog wrote a small test suite which utilizes performance monitoring counters in DOS/Windows/Linux (using a driver to access MSR registers where neccessary). I believe that will be good enough for me especially since it is highly customizable (with source code). The only downside is that it requires knowledge about specific counters but that shouldn't be a problem, at least for me.
- Mark as New
- Bookmark
- Subscribe
- Mute
- Subscribe to RSS Feed
- Permalink
- Report Inappropriate Content
>>Agner Fog has wrote a small ...
CodeAnalyst is free. Writtenas OpenSource. I haven't dug for the source files as it does what I need without me customizing it.
Jim Dempsey
- Mark as New
- Bookmark
- Subscribe
- Mute
- Subscribe to RSS Feed
- Permalink
- Report Inappropriate Content
Well the Agner's code is free and open source too and it uses event based sampling, that makes it better than CodeAnalyst in my opinion. It won't hurt if you take a look at it.
- Mark as New
- Bookmark
- Subscribe
- Mute
- Subscribe to RSS Feed
- Permalink
- Report Inappropriate Content
>>Well the Agner's code is free and open source too and it uses event based sampling, that makes it better than CodeAnalyst in my opinion. It won't hurt if you take a look at it.<<
I took a look at it and it is not quite suitable for my purposes.
Most of my programming is in IFV with some C++ and assembler
I am interested in whole application profiling not just timing one section of one routine.
I am interested in multi-threaded tuning
and I am interested in what additional overhead is occuring while the application runs.
CodeAnalyst does this for me whereas Agner's does not. If one were interested in tuning one small section of code then Agner's tool might be the way to go. My requirements are different (and so were yours as you ticked off the discussion points in this forum).
Jim Dempsey
- Mark as New
- Bookmark
- Subscribe
- Mute
- Subscribe to RSS Feed
- Permalink
- Report Inappropriate Content
I admit that Agner's solution is not suitable for everyone but if you already have the idea where the hotspot might be, it is ideal for finetuning.
- Subscribe to RSS Feed
- Mark Topic as New
- Mark Topic as Read
- Float this Topic for Current User
- Bookmark
- Subscribe
- Printer Friendly Page