- Mark as New
- Bookmark
- Subscribe
- Mute
- Subscribe to RSS Feed
- Permalink
- Report Inappropriate Content
HI,
I have a windows application which is devoleped in VS 2010.
My Windows application is refering a classlibrary and calling a publicing method exposed in the class.
During the profiling, it shows hotspot only from the source file in my parent application. Its not pointing to the real class which causes this issue.
If I devolepe the same application in VS 2008 and start an analysis, it willl give proper result.
Could you please help on this issue?
Thanks,
Sephy
Link Copied
5 Replies
- Mark as New
- Bookmark
- Subscribe
- Mute
- Subscribe to RSS Feed
- Permalink
- Report Inappropriate Content
I'm guessing that inter-procedural optimization may account for your issue. If so, you turn off the Qip and ipo options and rebuild, and in many cases still get similar performance with better resolution in reference to source code.
- Mark as New
- Bookmark
- Subscribe
- Mute
- Subscribe to RSS Feed
- Permalink
- Report Inappropriate Content
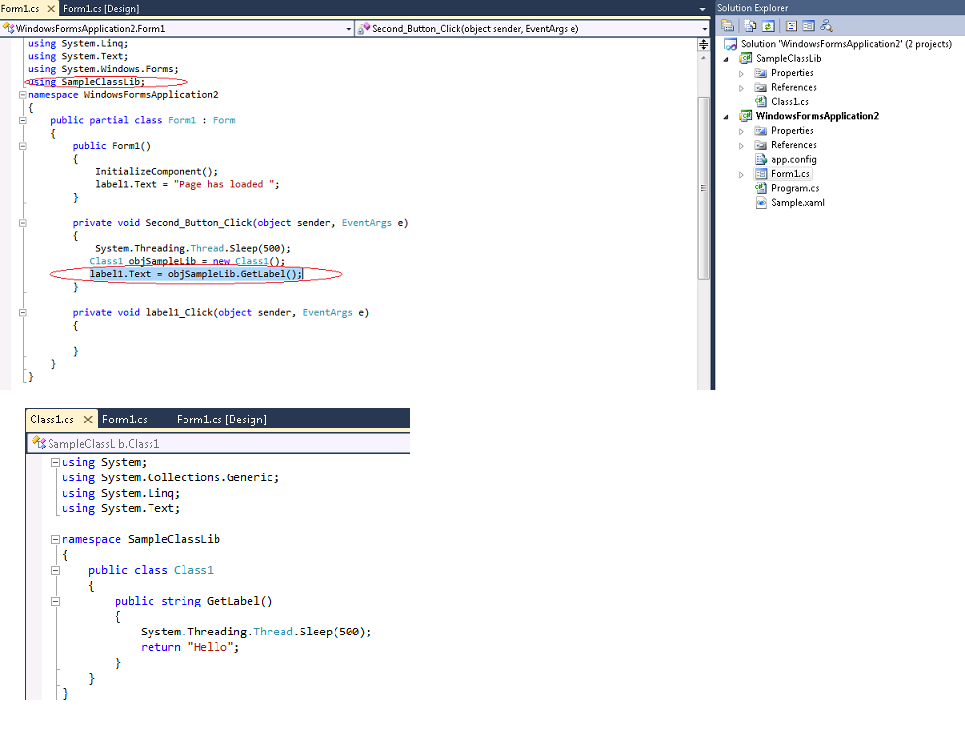
Basicaly, my Sample Project created in .net Using c#. So couldnt able to try the QIP and IPO optins.
I'm attaching the sample code which i tried.
Its working fine, when i compile the Projects in 3.5 FrameWork.
So is it a known issue in VS 2010 FrameWork 4.0? Will it not show the source codefrom the parent class ?
I'm attaching the sample code which i tried.
Its working fine, when i compile the Projects in 3.5 FrameWork.
So is it a known issue in VS 2010 FrameWork 4.0? Will it not show the source codefrom the parent class ?
- Mark as New
- Bookmark
- Subscribe
- Mute
- Subscribe to RSS Feed
- Permalink
- Report Inappropriate Content
Is it possible that inVS2010 build options for the library arediffernt than VS2008,
such as marked for using optimized code?
such as marked for using optimized code?
- Mark as New
- Bookmark
- Subscribe
- Mute
- Subscribe to RSS Feed
- Permalink
- Report Inappropriate Content
I seem to recall that Amplifier doesn't support profiling of C# code, a feature under consideration for inclusion again in future versions. I didn't recognize before this may be what you meant.
- Mark as New
- Bookmark
- Subscribe
- Mute
- Subscribe to RSS Feed
- Permalink
- Report Inappropriate Content
Intel VTune Amplifier XE supports profiling of C# code. There is an option in Amplifier XE project properties called "Managed code profiling mode". Try to set it to "Mixed". Can you also provide a code sample that you're analysing so we also try it?
Reply
Topic Options
- Subscribe to RSS Feed
- Mark Topic as New
- Mark Topic as Read
- Float this Topic for Current User
- Bookmark
- Subscribe
- Printer Friendly Page