- Mark as New
- Bookmark
- Subscribe
- Mute
- Subscribe to RSS Feed
- Permalink
- Report Inappropriate Content
Hello,
My CPU is Intel(R) Xeon(R) CPU E5-2620 0 @ 2.00GHz.
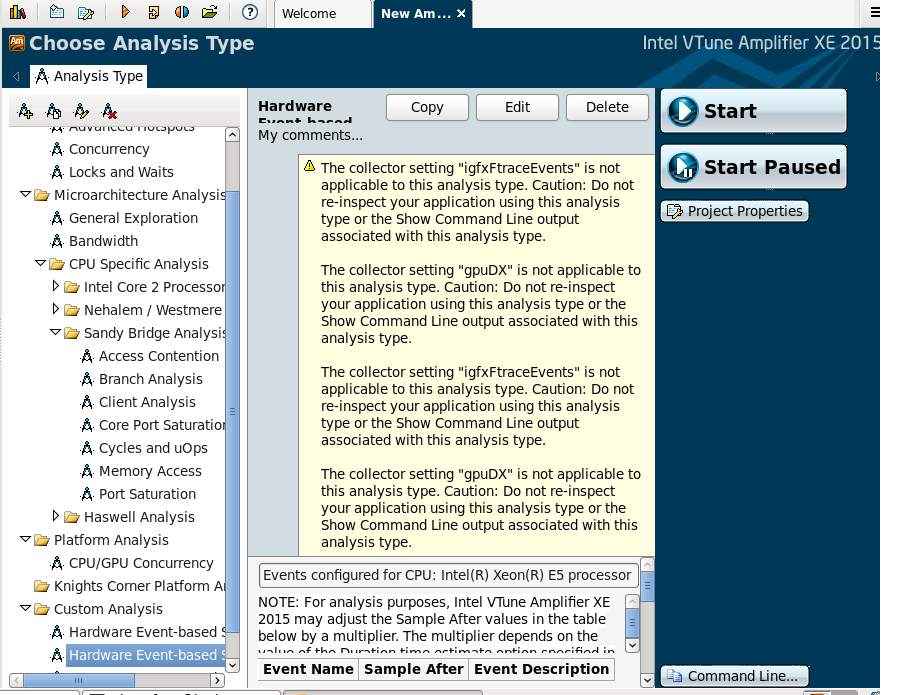
I choose the Microarchitecture Analysis/Bandwidth and start the testing.
In the Bandwidth viewpoint panel, where is the average Bandwidth?
I put my screen shot in the attachment. I cannot find the bandwidth.
I also use the command line and the result is as follows. The bandwidth is zero. How come?
Summary
-------
Elapsed Time: 70.813
CPU Time: 644.534
Average CPU Usage: 8.906
CPI Rate: 1.107
Average Bandwidth
-----------------
Package Bandwidth, GB/sec:Self
--------- ----------------------
package_0 0.0
package_1 0.0
Event summary
-------------
Hardware Event Type Hardware Event Count:Self Hardware Event Sample Count:Self Events Per Sample
------------------------------ ------------------------- -------------------------------- -----------------
CPU_CLK_UNHALTED.THREAD 1491714237568 745856 2000003
CPU_CLK_UNHALTED.REF_TSC 1285969928952 642984 2000003
INST_RETIRED.ANY 1347046020566 673522 2000003
MEM_LOAD_UOPS_RETIRED.LLC_MISS 3900273 39 100007
Uncore Event summary
--------------------
Hardware Event Type Hardware Event Count:Self
---------------------------------- -------------------------
UNC_M_CAS_COUNT.RD[UNIT0] 0
UNC_M_CAS_COUNT.RD[UNIT1] 0
UNC_M_CAS_COUNT.RD[UNIT2] 0
UNC_M_CAS_COUNT.RD[UNIT3] 0
UNC_M_CAS_COUNT.WR[UNIT0] 0
UNC_M_CAS_COUNT.WR[UNIT1] 0
UNC_M_CAS_COUNT.WR[UNIT2] 0
UNC_M_CAS_COUNT.WR[UNIT3] 0
UNC_Q_TxL_FLITS_G0.DATA[UNIT0] 0
UNC_Q_TxL_FLITS_G0.DATA[UNIT1] 0
UNC_Q_TxL_FLITS_G0.NON_DATA[UNIT0] 0
UNC_Q_TxL_FLITS_G0.NON_DATA[UNIT1] 0
amplxe: Executing actions 100 % done
Link Copied
- Mark as New
- Bookmark
- Subscribe
- Mute
- Subscribe to RSS Feed
- Permalink
- Report Inappropriate Content
- Mark as New
- Bookmark
- Subscribe
- Mute
- Subscribe to RSS Feed
- Permalink
- Report Inappropriate Content
Was it possible due to low memory access in your program? It caused "0.0" on Average Bandwidth. My case -
>amplxe-cl -collect bandwidth -d 10 -- cache-test.exe
Result Size 22688730
Collection start time 04:09:26 29/06/2015 UTC
Collection stop time 04:09:36 29/06/2015 UTC
CPU
---
Parameter r004bw
----------------- -------------------------------------------------
Name 4th generation Intel(R) Core(TM) Processor family
Frequency 2494319624
Logical CPU Count 4
Summary
-------
Elapsed Time: 10.002
CPU Time: 9.749
Average CPU Usage: 0.984
CPI Rate: 0.947
Average Bandwidth
-----------------
Package Bandwidth, GB/sec:Self
--------- ----------------------
package_0 3.929
- Mark as New
- Bookmark
- Subscribe
- Mute
- Subscribe to RSS Feed
- Permalink
- Report Inappropriate Content
Hello Zhang,
What exact update of VTune 2015 do you use?
Thanks & Regards, Dmitry
- Mark as New
- Bookmark
- Subscribe
- Mute
- Subscribe to RSS Feed
- Permalink
- Report Inappropriate Content
dmitry-prohorov,
My VTune version is:
/opt/intel/vtune_amplifier_xe_2015/bin64 $ ./amplxe-cl --version
Intel(R) VTune(TM) Amplifier XE 2015 Update 2 (build 393444) Command Line Tool
Copyright (C) 2009-2014 Intel Corporation. All rights reserved.
Peter,
You are right. Maybe it is zero.
I want to ask 3 question:
Question 1:
Is the command "amplxe-cl -collect bandwidth" really get the exact bandwidth? I do not know.
Thanks for your suggestion, I run another well-known benchmark NPB (http://www.nas.nasa.gov/publications/npb.html), but the bandwidth is as follows(bt for example, others are similar). Don't you think it is too small? The theoretical bandwidth of the machine could be more than 20 GB/sec, why these bandwidth of programs are so small? Is something wrong? I think it should be bigger.
Package Bandwidth, GB/sec:Self
--------- ----------------------
package_0 0.005
package_1 0.017
Question 2:
If I cannot find a L1I* event in VTune, does it suggest that this CPU does not support the L1 instruction performance counter?
I want to see some L1 instruction cache behaviors so I click the "Add Events" and want to find L1 instruction cache events. I search "L1I" but got nothing. However, when I use perf in Linux, I can get L1 instruction data. For example, the followings are the results of the command "perf stat -e L1-icache-loads-misses". Why I cannot find an event in VTune?
4,258,939 L1-icache-misses
# 0.00% of all L1-icache hits [36.37%]
Question 3:
Why two E5620, one provide these events, but the other does not?
All the former test is done on a E5-2620 0 @ 2.00GHz.
I have another machine whose CPU is also E5620 @ 2.40GHz.
When I run the same command, it goes wrong!
ERROR: Invalid Event MEM_LOAD_UOPS_RETIRED.L1_HIT discarded
ERROR: Invalid Event MEM_LOAD_UOPS_RETIRED.L2_HIT discarded
ERROR: Invalid Event MEM_LOAD_UOPS_RETIRED.LLC_HIT discarded
ERROR: Invalid Event MEM_LOAD_UOPS_RETIRED.LLC_MISS discarded
It also does not provide bandwidth. For example.
/opt/intel/vtune_amplifier_xe_2015/bin64/amplxe-cl -collect bandwidth -app-working-dir /home/ -- ls
amplxe: Fatal error: Cannot enable Hardware Event-based Sampling: problem with the driver (sep*/sepdrv*). Check that the driver is running and the driver group is in the current user group list. See "Building and Managing the Sampling Driver" help topic for further details.
amplxe: Fatal error: This analysis type is not applicable to the current machine microarchitecture.
Why two E5620, one provide these events, but the other does not?
Hope for your reply.
- Mark as New
- Bookmark
- Subscribe
- Mute
- Subscribe to RSS Feed
- Permalink
- Report Inappropriate Content
The memory bandwidth required by the NPB codes will depend on which problem size you decided to run. The smaller problem sizes (S, W, and probably A) will be completely cache-contained on a modern system, so the only memory traffic will be the initial load of the data. The Class C problem size should require much more memory than can be cached while still easily fitting in the main memory of a Xeon E5-2620 system.
If my old notes are still relevant, I would expect the IS, CG, and MG benchmarks should use the most memory bandwidth (once the problem size is much larger than the available cache). FT and LU use significantly less than the first three, SP is somewhat lower than FT and LU, and BT uses much less than SP. The EP benchmark is completely cache-contained on almost any system, so it uses essentially no memory bandwidth. Things might have changed, but I would still expect these overall trends to hold. Looking at the problem size descriptions at http://www.nas.nasa.gov/publications/npb_problem_sizes.html, it looks like you might need to go to the Class D problem size to ensure that the CG benchmark does not fit in the 30 MiB total L3 cache provide by two Xeon E5-2620 processors.
- Mark as New
- Bookmark
- Subscribe
- Mute
- Subscribe to RSS Feed
- Permalink
- Report Inappropriate Content
> I want to see some L1 instruction cache behaviors so I click the "Add Events" and want to find L1 instruction cache events.
Different CPU type might have different event name for L1 Miss. It only spends 5-6 cycles on penalty, you need to focus on L2 Miss I think.
# sep -el | grep L1
>amplxe: Fatal error: Cannot enable Hardware Event-based Sampling: problem with the driver (sep*/sepdrv*).
Ensure if vtune drivers are loaded into system.
# lsmod | grep [sep | pax | vtsspp]
amplxe: Fatal error: This analysis type is not applicable to the current machine microarchitecture.
E5620 is an old processor (Q1 2010 launch, Nehalem processor), I don't think it supports bandwidth analysis type.
- Mark as New
- Bookmark
- Subscribe
- Mute
- Subscribe to RSS Feed
- Permalink
- Report Inappropriate Content
Hello,
Most likely you have different behavior on these two machines because of two reasons:
1) E5-2620 - is Sandy Bridge CPU based machine and E5620 is Westmere based machine. For SNB VTune has predefined bandwidth analysis type, for WSM it does not. The event sets are in general different so not all events from one processor are available on the second.
2) On E5-2620 you have SEP driver installed, on E5620 it is not so VTune tries to collect events through perf but in this mode it has limitations like uncore events are not supported.
On instruction case mises - on SNB there is an event ICASH.MISSES that might help. You also can collect general exploration analysis type for SNB processor and the metric will be under Front-End bound category.
I would also recommed to upgrade VTune to the laters Update 4.
Thanks & Regards, Dmitry
- Mark as New
- Bookmark
- Subscribe
- Mute
- Subscribe to RSS Feed
- Permalink
- Report Inappropriate Content
Hello, Dmitry, John. Peter,
Thanks for your kind reply. Your answer really helps me.
For Question 2:
There is an event named "ICACHE.MISSES". This is the L1I cache indicator, right?
However, I cannot find an event named "ICACHE.HITS". Is there any L1I hit events? Or How can I get the L1I accesses?
When I use Linux perf, I can get the following messages. How can perf get the L1I loads?
perf stat -e ,L1-icache-loads-misses,L1-icache-loads
509,445,231 L1-icache-loads-misses # 3.92% of all L1-icache hits [33.71%]
12,987,552,473 L1-icache-loads [33.73%]
For Question 1:
I am just not sure if this bandwidth is the true bandwidth.
I read that " It does not take into account streaming stores. For an application using streaming stores, bandwidth will be underestimated." from the following URL.
For VTune, does it take the streaming stores into account? I am not familiar with the streaming stores. Does it exist on common CPUs?
I then use the STREAM benchmark (http://www.cs.virginia.edu/stream/) to test and the result is close. I think it is right.
But I do not know if it reflects the real bandwidth for all programs, in all time? Such as streaming stores, perhaps?
/opt/intel/vtune_amplifier_xe_2015/bin64/amplxe-cl -collect bandwidth -app-working-dir /home/zhang/stream -- /home/zhang/stream/stream_c.exe
Package Bandwidth, GB/sec:Self
--------- ----------------------
package_0 0.066
package_1 12.646
Add: 12542.5 0.019216 0.019135 0.019266
Triad: 12466.8 0.019267 0.019251 0.019289
I do not know the following commands. Forget it. :)
[root@hydrogen ~]# sep -el | grep L1
-bash: sep: command not found
[root@hydrogen ~]# lsmod | grep [sep | pax | vtsspp]
-bash: vtsspp]: command not found
- Mark as New
- Bookmark
- Subscribe
- Mute
- Subscribe to RSS Feed
- Permalink
- Report Inappropriate Content
The warning about bandwidth being underestimated with streaming stores (at https://software.intel.com/en-us/articles/optimization-and-performance-tuning-for-intel-xeon-phi-coprocessors-part-2-understanding) refers to Xeon Phi and may not apply to other Intel processors.
On the Xeon E5-2620, VTune should be using the performance counters in the "integrated memory controller" of the "uncore" to count read and write traffic at the DRAMs. These are completely independent of the performance counters in the core(s). In my experience these DRAM counters are quite accurate on all Xeon E5-2600 series processors (Sandy Bridge, v2=Ivy Bridge, and v3=Haswell). The DRAM counters will count all memory transactions, including transactions due to IO. With streaming stores the counts are usually a few percent higher than expected (for both reads and writes), but I suspect that this is accurate also -- it is a side effect of streaming stores that get broken up into multiple transactions. The precise number of these "prematurely flushed" streaming stores might be available in a different "uncore" counter, but the discrepancy is small enough that I have not bothered to look into it.
I don't know how to be sure what VTune is actually using, however -- which is why I prefer to manage all of the counters manually. There are other approaches to estimating the memory bandwidth using LLC misses and writebacks. In my experience these are more prone to bugs or misunderstandings than simply counting at the DRAMs.
- Subscribe to RSS Feed
- Mark Topic as New
- Mark Topic as Read
- Float this Topic for Current User
- Bookmark
- Subscribe
- Printer Friendly Page