- Mark as New
- Bookmark
- Subscribe
- Mute
- Subscribe to RSS Feed
- Permalink
- Report Inappropriate Content
I have an app which has 5 threads. Main thread essentially waits for other threads to complete doing nothing. (thread::join). Two threads are working as worker threads for two pools. These threads check for items in the pool in a tight while loop and if items found process them. One remaining threads handles asynchronous network calls. Other thread also handle network IO with which use SSL.
When analyzed using vtune profiler, I get 'poor' effective CPU utilization for all 4 threads. I am trying to understand what this means. For example, two threads that are in busy loops effectively utilize the one core each - 100% utilization. Still the profiler shows that cores are not effectively utilized. What does this mean?
Link Copied
- Mark as New
- Bookmark
- Subscribe
- Mute
- Subscribe to RSS Feed
- Permalink
- Report Inappropriate Content
Hi,
Thanks for reaching out to us.
Could you please share the following information for better understanding of the scenario and for providing a proper solution:
- Host OS
- Vtune profiler version
- It would be great if you could share the result directory/report you got after the collection of analysis results so that we can analyze the report from our end.
Regards,
Raeesa
- Mark as New
- Bookmark
- Subscribe
- Mute
- Subscribe to RSS Feed
- Permalink
- Report Inappropriate Content
Hi
- Host OS - Ubuntu 20.04
- Vtune profiler - I used the one which had 2021.3.0.3219 in the file name.
Sorry I had to format my machine and change to Fedora, so lost the profiling run log. I will do a re-run and post results soon.
- Mark as New
- Bookmark
- Subscribe
- Mute
- Subscribe to RSS Feed
- Permalink
- Report Inappropriate Content
- Mark as New
- Bookmark
- Subscribe
- Mute
- Subscribe to RSS Feed
- Permalink
- Report Inappropriate Content
Hi,
Thank you for responding. We looked into the results you shared and it seems fine.
In regard to this statement : “When analyzed using vtune profiler, I get 'poor' effective CPU utilization for all 4 threads”, Could you please share the screenshot of Vtune gui result where you saw that all 4 threads are having poor CPU utilization.
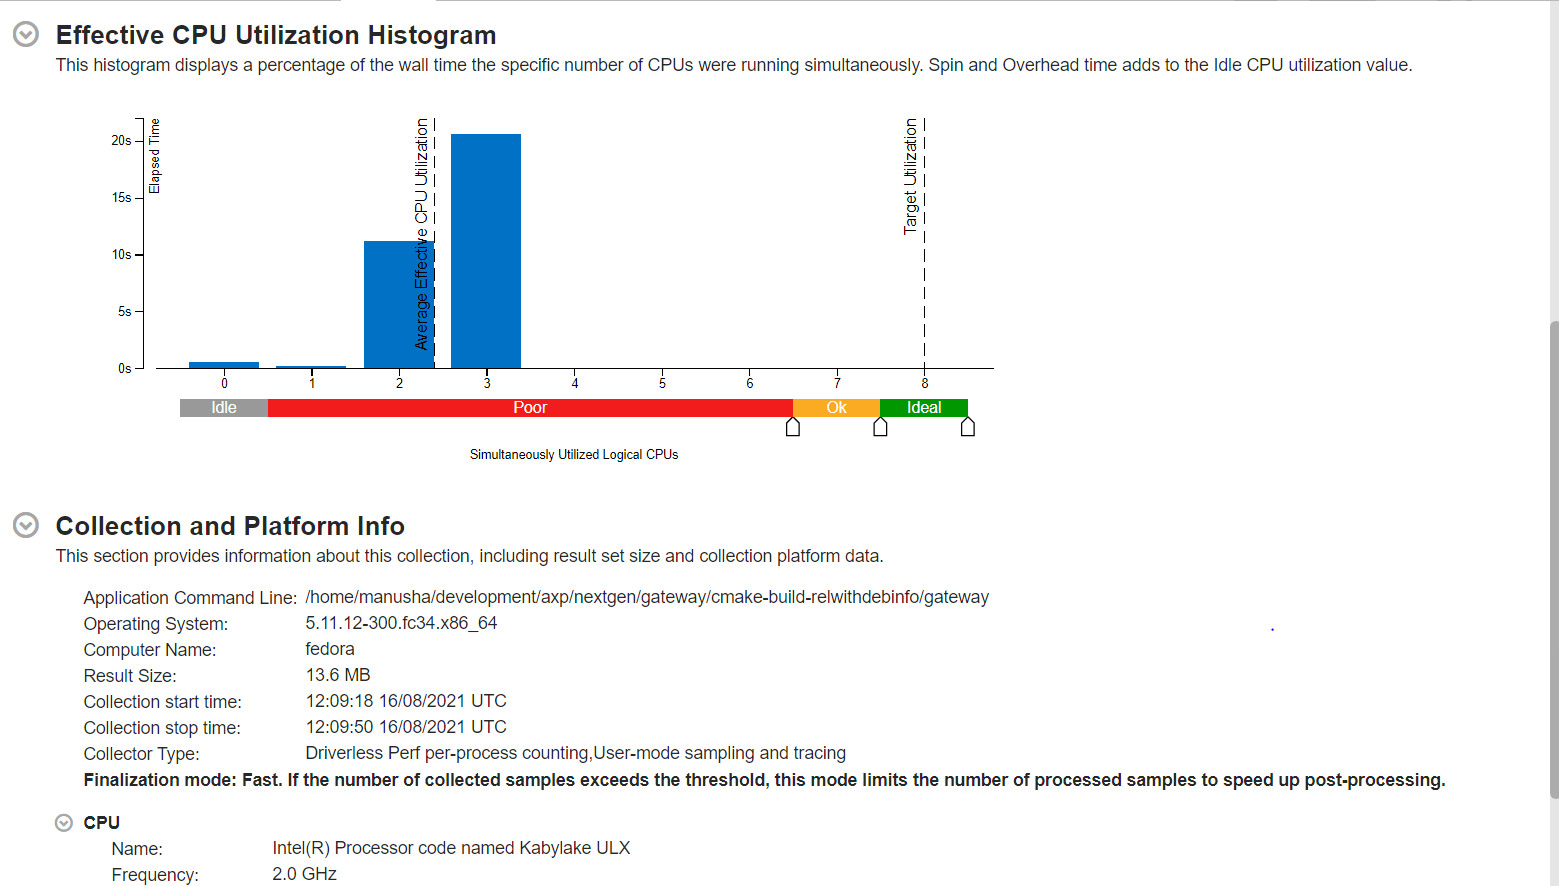
The effective CPU utilization histogram in the summary tab of the result basically shows the percentage of the wall time the specific number of logical CPUs were running simultaneously. For example, in the below screenshot the highest bar depicts that 3 logical CPUs were simultaneously utilized for 20s. Hope its clear.
More Info regarding the graph : https://software.intel.com/content/www/us/en/develop/documentation/vtune-help/top/reference/user-interface-reference/window-summary/window-summary-hotspots-by-cpu-usage.html
Let us know if this helps or get back to us in case of any issues or clarifications.
Regards,
Raeesa
- Mark as New
- Bookmark
- Subscribe
- Mute
- Subscribe to RSS Feed
- Permalink
- Report Inappropriate Content
Hi,
Did the solution provided helped you ? Please let us know the updates.
Thanks and Regards,
Raeesa
- Mark as New
- Bookmark
- Subscribe
- Mute
- Subscribe to RSS Feed
- Permalink
- Report Inappropriate Content
Hi ,
I assume that your issue is resolved. If you need any additional information, please post a new question as this thread will no longer be monitored by Intel.
Thanks and Regards,
Raeesa
- Subscribe to RSS Feed
- Mark Topic as New
- Mark Topic as Read
- Float this Topic for Current User
- Bookmark
- Subscribe
- Printer Friendly Page