Analyzers
Talk to fellow users of Intel Analyzer tools (Intel VTune™ Profiler, Intel Advisor)

Context Switch

Ami_Marowka
Beginner
863 Views

Is it possible to observe how many context switches were performed per run/per thread/per core with Intel VTune Amplifier XE for Windows?

Thanks in Advance

Ami

0 Kudos
8 Replies
Peter_W_Intel
Employee
863 Views
I suggest you to use L1 DTLB misses event to measure small page fault, and L2DTLB misses event to measure large page fault.

Regards, Peter
0 Kudos
Hagen_G_
Beginner
863 Views

Hi Peter,

I am also interested in this measure. I have tried a Nehalem general exploration. On the screen where you push the "Start" button it lists "DTLB_MISSES.ANY" in the event table. However, after having performed the analysis, I don't find a DTLB measure anywhere in the results table. Can you help me how to access that information?

Regards, Hagen

0 Kudos
Bernard
Valued Contributor I
863 Views

I think that number of context switches is not measured by any hardware counter.You can include in profiling OS system files(ntoskrnl.exe) and look for NtSwapContext function on the top every thread's stack.Of course it will give a very crude estimation of exact number of context switches.

0 Kudos
Bernard
Valued Contributor I
863 Views

@Ami

Xperf tool will give an exact number of context switches.

0 Kudos
David_A_Intel1
Employee
863 Views

Hey, guys!

Just check out the documentation, here and here! ;)

Synchronization Context Switches

Synchronization Context Switches metric measures the number of times a thread was switched off a processor because of making an explicit call to thread synchronization API. For example, in case of trying to wait on a synchronization object already occupied by another thread, the number of synchronization context switches will characterize the level of contention between threads.

This metric is available in the Hardware Event Counts viewpoint if you enabled the Collect stacks option during the hardware event-based sampling analysis configuration.
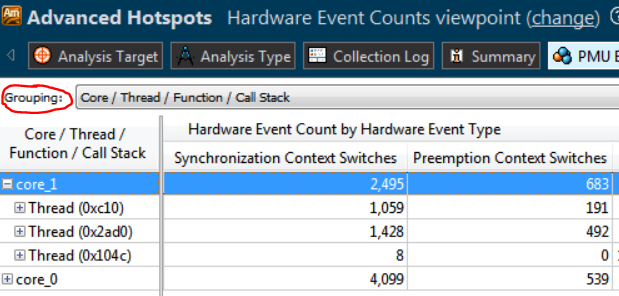
Preemption Context Switches

Preemption Context Switches metric measures a number of times the operating system task scheduler switched a thread off a processor to run another, higher-priority thread.

This metric is available in the Hardware Event Counts viewpoint if you enabled the Collect stacks option during the hardware event-based sampling analysis configuration.
Then view the results and use the grouping control:

contextswitches.PNG

0 Kudos
Bernard
Valued Contributor I
863 Views

@MrAnderson

Thank you for that valuable information.Now I can see context switching count from within VTune without the need to use additional tools.

0 Kudos
Peter_W_Intel
Employee
863 Views

Hagen G. wrote:

Hi Peter,

I am also interested in this measure. I have tried a Nehalem general exploration. On the screen where you push the "Start" button it lists "DTLB_MISSES.ANY" in the event table. However, after having performed the analysis, I don't find a DTLB measure anywhere in the results table. Can you help me how to access that information?

Regards, Hagen

General exploration analysis cannot include all events...you can use command line directly like as below, then use amplxe-gui to open result.

amplxe-cl -collect-with runsa -knob event-config=CPU_CLK_UNHALTED.CORE,DTLB_MISSES.ANY -- your-app
 

0 Kudos
David_A_Intel1
Employee
863 Views

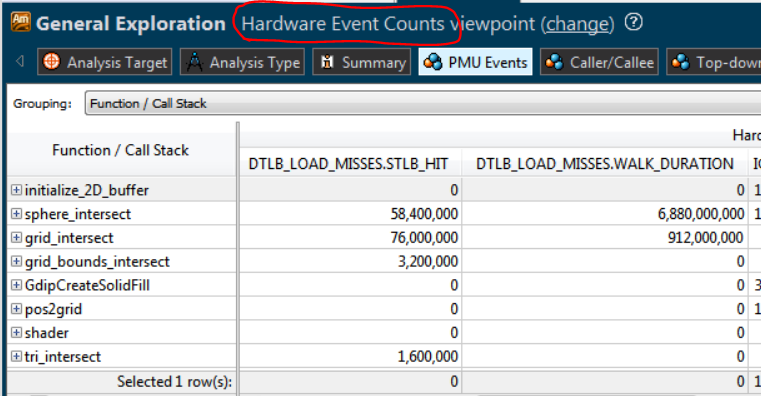
I think Hagen G. meant that the event *is* collected by GE, but is not displayed in the table.

@Hagen. B, this may be a viewpoint issue.  By default, the General Exploration analysis type uses the General Exploration viewpoint, attempting to highlight potential efficiency issues in your code.  If you want to look at the actual events, you can switch to either the Hardware Event Counts or Hardware Event Sample Counts viewpoint.  For example,


hardwareeventcounts.PNG

0 Kudos
Reply