- Mark as New
- Bookmark
- Subscribe
- Mute
- Subscribe to RSS Feed
- Permalink
- Report Inappropriate Content
I have a GPU_offload result from a run on a PVC. A few days ago I was looking at the source code and assembly for a slow kernel. However, my machine rebooted, and now I cannot recall how I got it to display source and assembly. Nothing I try works, even though I am looking at the same result.
- Mark as New
- Bookmark
- Subscribe
- Mute
- Subscribe to RSS Feed
- Permalink
- Report Inappropriate Content
Link Copied
- Mark as New
- Bookmark
- Subscribe
- Mute
- Subscribe to RSS Feed
- Permalink
- Report Inappropriate Content
Hi,
Thanks for posting in Intel Communities.
Please follow the steps below to view the source code after performing GPU Offload in VTune:
1. Open VTune and navigate to the GPU Offload results of your application.
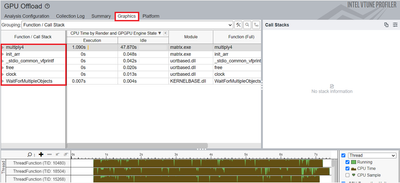
2. Click on the Graphics tab. The Function/Call Stack list are displayed on the left side of the page as given in the below screenshot.
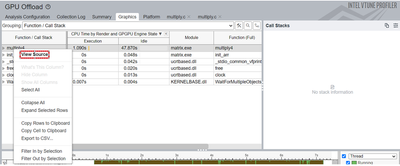
3. To view the source code, you can right-click on the relevant function and select the option View Source as shown in the screenshot attached below (or can simply double click on the function).
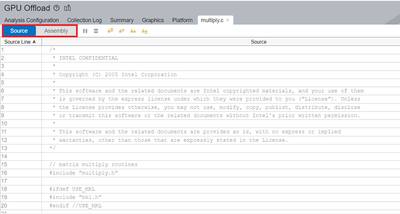
4. You will be then navigated to the page where source code and assembly code are given, like the screenshot attached below:
Hope this resolves your issue. If this resolves your issue, kindly accept this as a solution as it would help others with a similar issue.
Regards,
Thasneem Vazim
- Mark as New
- Bookmark
- Subscribe
- Mute
- Subscribe to RSS Feed
- Permalink
- Report Inappropriate Content
Thanks! That worked.
- Mark as New
- Bookmark
- Subscribe
- Mute
- Subscribe to RSS Feed
- Permalink
- Report Inappropriate Content
Hi,
Glad to know that your issue is resolved. If you need any additional information, please post a new question as this thread will no longer be monitored by Intel.
Regards,
Thasneem Vazim
- Subscribe to RSS Feed
- Mark Topic as New
- Mark Topic as Read
- Float this Topic for Current User
- Bookmark
- Subscribe
- Printer Friendly Page


