- Mark as New
- Bookmark
- Subscribe
- Mute
- Subscribe to RSS Feed
- Permalink
- Report Inappropriate Content
Hello,
I am new to VTune and have been trying to interpret the times reported in VTune. I have a Fortran application I have been playing with to understand the effect of openmp threading on the performance of the application. I have been using VTune to identify the hotspots. To perform collection for VTune, I use the very basic commands for openmp hotspot analysis - amplxe-cl -collect hotspots -knob analyze-openmp=true <target application>
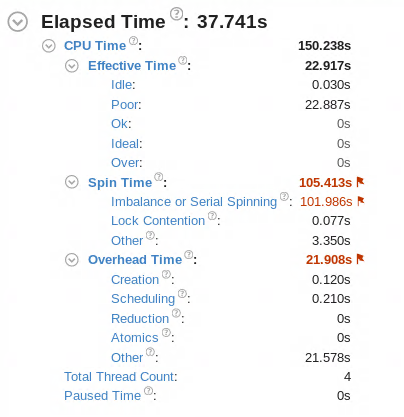
I have been seeing some strange behavior ( or probably normal behavior that appears strange only to me due to my lack of experience with VTune). With OMP_NUM_THREADS=1, I get an effective time lower than that obtained for when OMP_NUM_THREADS=4. I have attached a couple of images for reference. There is a huge spin and overhead time associated with OMP_NUM_THREADS=4. However my understanding is that the effective time does not take into account the spin or overhead times. So I fail to understand why is the effective time so much higher for OMP_NUM_THREADS=4. Any insight into this behavior would be extremely helpful for me to better understand how to interpret the times reported in VTune.
Please note, when running the application without VTune, and using the time command in Linux, the reported wall time for OMP_NUM_THREADS=1 matches for when the application is run using VTune. However this isn't the case for OMP_NUM_THREADS where VTune reports a higher effective time than the wall time reported by Linux.
Thank you,
Ashesh Sharma
Link Copied
- Mark as New
- Bookmark
- Subscribe
- Mute
- Subscribe to RSS Feed
- Permalink
- Report Inappropriate Content
Hello,
We need more information to explore on the case.
If you have -knob analyze-openmp=true then Summary pane should contain a section for OpenMP analysis for the case with OMP_NUM_THREADS=4. Could you please make screenshot of the section?
Also - what is the number of physical cores on the system? Do you run the application exclusively? What is the semantics of OpenMP usage in your application?
If you can attach the result directory for the case of OMP_NUM_THREADS=4 it will also be additionally helpful to look at.
Thank you, Regards, Dmitry
- Mark as New
- Bookmark
- Subscribe
- Mute
- Subscribe to RSS Feed
- Permalink
- Report Inappropriate Content
I'd also recommend to make the following experiment - check elapsed time with OpenMP analysis turned off:
> amplxe-cl -collect hotspots -knob analyze-openmp=false <target application>
- Mark as New
- Bookmark
- Subscribe
- Mute
- Subscribe to RSS Feed
- Permalink
- Report Inappropriate Content
Hello Dimitry and Vitaly,
I am attaching a screenshot for the section for OpenMP analysis for OMP_NUM_THREADS=4.
There are 16 physical cores on the node. Please see the description of compute nodes in the following link - https://www.nrel.gov/hpc/peregrine-system.html
Since I am running this case on an HPC system, I am sure I am running the application exclusively.
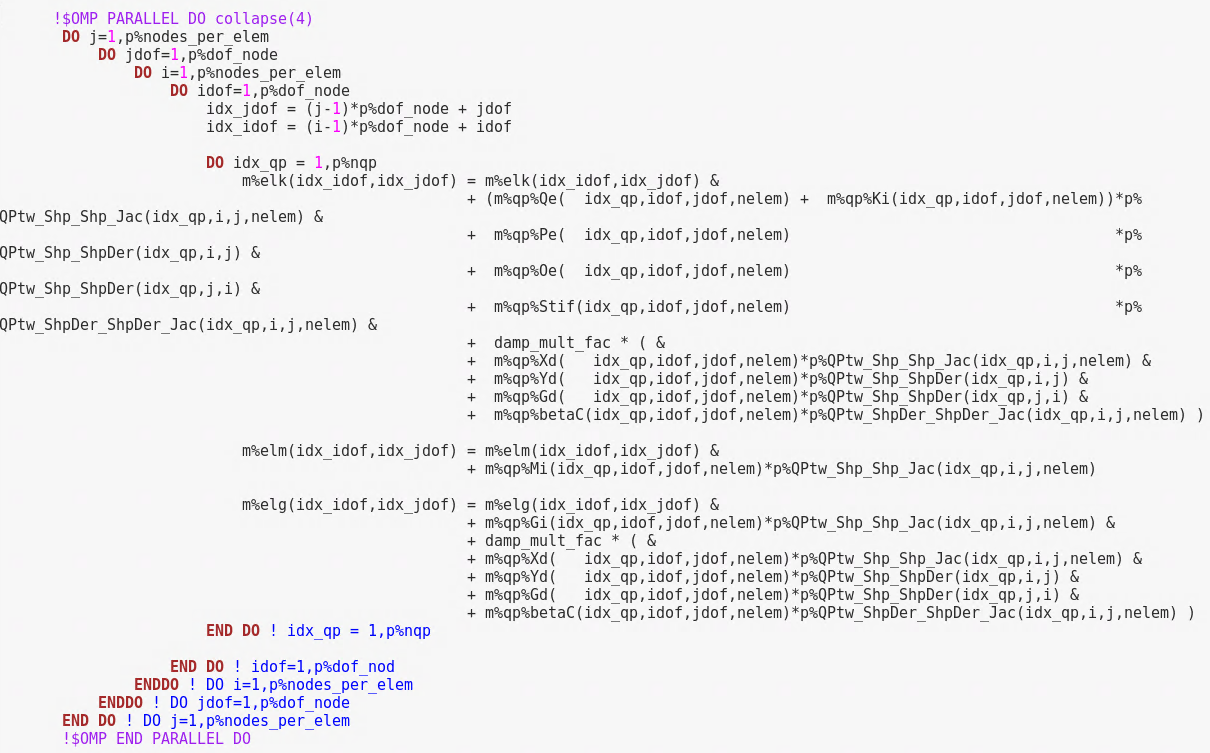
The only usage of openmp is for parallelizing loops in exactly 1 subroutine. I am attaching a snapshot of this too.
The result directory upon compression is unfortunately larger than 250MB. Hence I am unable to attach it.
I further ran the analysis with -knob analyze-openmp=false, and the elapsed time remains unchanged.
Thank you,
Ashesh Sharma
- Mark as New
- Bookmark
- Subscribe
- Mute
- Subscribe to RSS Feed
- Permalink
- Report Inappropriate Content
Hello,
Could you please run advanced-hotspot collection with stacks and see what it will show? In command line this should be like:
>amplxe-cl -c a-h -knob collection-detail=stack-sampling -data-limit=0 -knob analyze-openmp=true -r <result_dir> <my_app>
It has more precise measurement and will allow to look at context switches/thread migration if it matters.
Thanks & Regards, Dmitry
- Subscribe to RSS Feed
- Mark Topic as New
- Mark Topic as Read
- Float this Topic for Current User
- Bookmark
- Subscribe
- Printer Friendly Page