- Mark as New
- Bookmark
- Subscribe
- Mute
- Subscribe to RSS Feed
- Permalink
- Report Inappropriate Content
Hi,
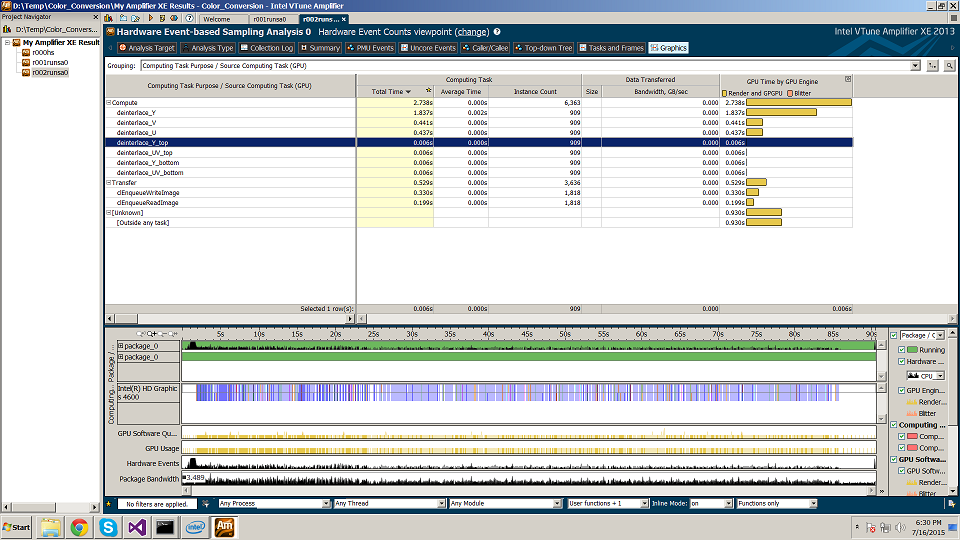
I am using the INtel Vtune 2013 version and whenever I do the profiling for Advanced hotspots with Trace the OPENCL kernels option enabled.
Attached is the screenshot for my GPU profiling. It doesn't show the info about EU array, sampler etc. Like shown in
Also,
my intel software manager says my intel vtune product software services has expired.
I am not able to differentiate if it is a licence issue or any other related to drivers etc. Though I have the latest drivers in my machine
intel CoreTM i7-4770 CPU @3.4 GHz
INtel HD Graphics 4600.
Link Copied
- Mark as New
- Bookmark
- Subscribe
- Mute
- Subscribe to RSS Feed
- Permalink
- Report Inappropriate Content
Hi,
I see you are using some custom analysis. Did not you forget to enable Processor Graphics events collection (see attached screenshot)?

- Mark as New
- Bookmark
- Subscribe
- Mute
- Subscribe to RSS Feed
- Permalink
- Report Inappropriate Content
Hi ALexandr,
I enabled this option before starting the profiling. I think the Graphics Tab in the attached screenshot is visible only if we enable this option.Right?
- Mark as New
- Bookmark
- Subscribe
- Mute
- Subscribe to RSS Feed
- Permalink
- Report Inappropriate Content
Hi,
Could you please share collected result with me? (Hint: right click on the result to get the link to the path to it

- Mark as New
- Bookmark
- Subscribe
- Mute
- Subscribe to RSS Feed
- Permalink
- Report Inappropriate Content
Also, I see that you are using version 2013. It probably makes the most sense for you to update to the latest release, version 2015 Update 4. Naturally, we have continued to add more and more support for GPU profiling. You also need to ensure you have the latest video driver.
- Subscribe to RSS Feed
- Mark Topic as New
- Mark Topic as Read
- Float this Topic for Current User
- Bookmark
- Subscribe
- Printer Friendly Page