- Mark as New
- Bookmark
- Subscribe
- Mute
- Subscribe to RSS Feed
- Permalink
- Report Inappropriate Content
Not 100% sure if this is the correct sub-forum, please be gentle...
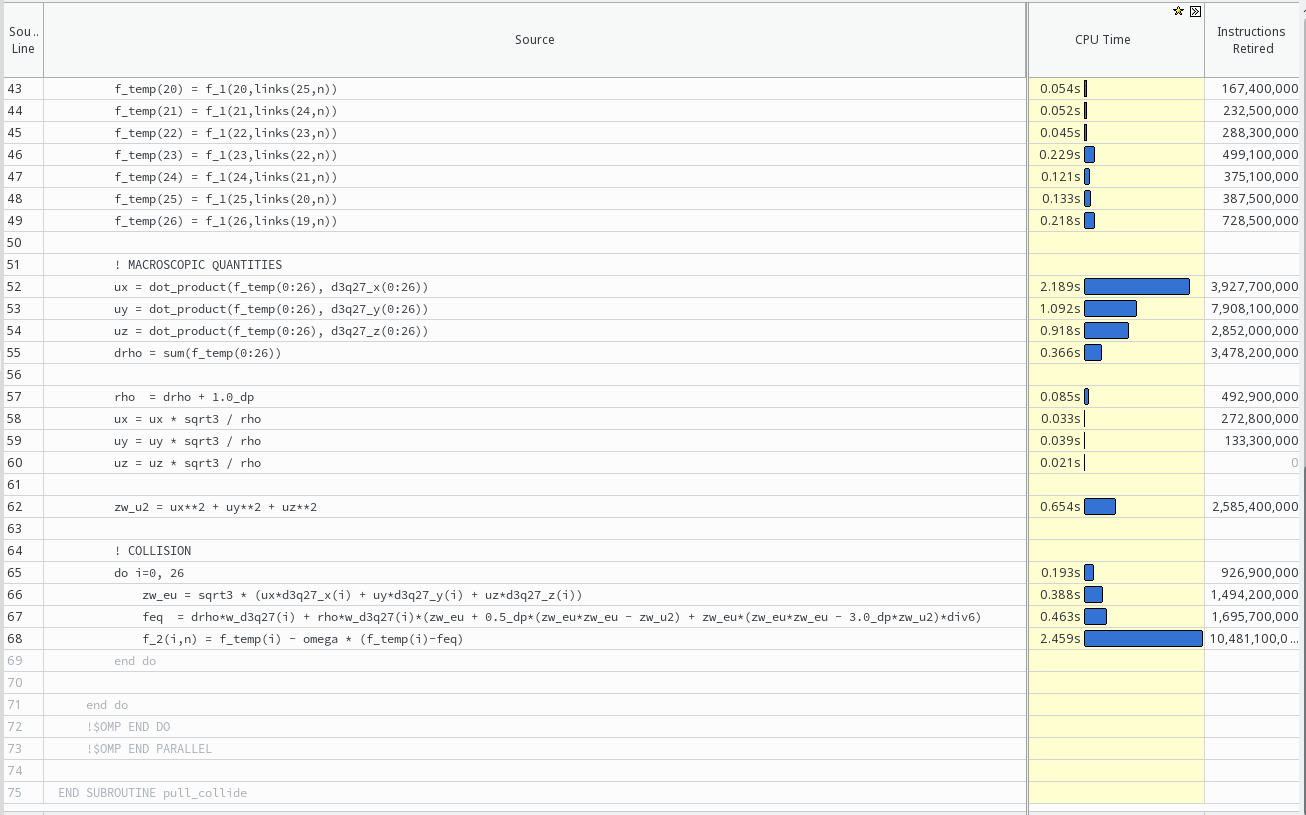
I am currently trying to optimise a code for execution time. Hence the use of VTune Amplifier. I have some doubts/questions about the accuracy/relevance of the "cpu time" column. Here is a result from my code:
-See Attachments-
For example, I can not quite understand why line 34 "f_temp(11) = f_1(11,links(14,n))" takes so much longer than all of the similar lines.
So I tried swapping the order of lines, putting this one first. Surprisingly, now the line that took it's place as the 12th line of this block took equally long to execute, according to VTune amplifier.
Is this a real effect or am I falling prey to some kind of measurement error/aliasing effect?
For this analysis I used a single (pinned) thread on a system with 2x Xeon 2687W v3. The clock speed was locked to 3GHz. Compiler options were -O3 -ip -ipo -xHost -fopenmp -g. Ifort version is 18.0.03 on a Linux operating system. Advanced hotspot analysis with 1ms sampling interval.
And a follow-up: provided the line-by-line results are anything to go by, how would I optimise the code further for execution time?
I could imagine that the indirect memory access here causes a lot of LLC misses and makes the code memory (latency) bound. Additional analyses using VTune Amplifier seem to confirm this. But as far as I can tell there is not much I could do about it. The nodes are already reordered using a space-filling curve to increase data locality. And then why would only some of those lines with indirect memory access take up most of the time. Anything I am missing here? The problem size used in this example does not fit into cache, which will be the use-case later.
Another possibility -judging by publications in this area- could be streaming stores. This might be able to reduce the time taken by the last line of the code shown "f_2(i,n) = f_temp(i) - omega * (f_temp(i)-feq)". However, I have no idea how I would implement this. All the samples I could find used different languages.
Link Copied
- Mark as New
- Bookmark
- Subscribe
- Mute
- Subscribe to RSS Feed
- Permalink
- Report Inappropriate Content
If high levels of optimization are used, compilers can produce inaccurate ‘address to source location’ map for debugging info. I would suggest to look at the disassembly of this code and see how instructions are mapped to source.
- Mark as New
- Bookmark
- Subscribe
- Mute
- Subscribe to RSS Feed
- Permalink
- Report Inappropriate Content
I can't say that I fully understand what this would entail. I assume learning Assembler language would be part of it?
- Mark as New
- Bookmark
- Subscribe
- Mute
- Subscribe to RSS Feed
- Permalink
- Report Inappropriate Content
To figure out why ‘f_temp(11) = f_1(11,links(14,n))’ line takes much time we should start with understanding what code is generated by compiler, what instructions consume most of time and what source lines these instructions are associated with. It is possible to enable the Assembly pane in the VTune Source/Assembly window. Each instruction in the Assembly pane has source line and CPU time information.
- Mark as New
- Bookmark
- Subscribe
- Mute
- Subscribe to RSS Feed
- Permalink
- Report Inappropriate Content
The "CPU time" is more accurate at larger scales. Within a basic block, the details of the interaction of the interrupt hardware with the out-of-order processor engine can result in systematic shifts of the attribution of high-latency instructions to (typically) nearby instructions.
In your case, the CPU time of the entire routine is probably a reasonable estimate. If you want to know which specific loads are taking the longest (e.g., for indirect loads, the latency will depend on the values of the indirection array, and might contain some "non-local" values or values that conflict somewhere in the cache hierarchy), the "Load Latency" facility is the most accurate approach. This uses the Precise Event-Based Sampling (PEBS) system to record a relatively large amount of information about specific (randomly sampled) load instructions.
I typically use "perf mem record" to capture load latency samples and "perf mem report" to generate a report. The output files are big, but provide comprehensive information about the address translation (TLB hit/miss), the location where the data was found in the cache hierarchy, and the load to use latency in cycles.
- Subscribe to RSS Feed
- Mark Topic as New
- Mark Topic as Read
- Float this Topic for Current User
- Bookmark
- Subscribe
- Printer Friendly Page