- Mark as New
- Bookmark
- Subscribe
- Mute
- Subscribe to RSS Feed
- Permalink
- Report Inappropriate Content
Hi,
I have been having problems interpreting the results for the analysis of one function in my code. I am analysing the roofline results for an application. While doing so I started to check the number of GFLop and the elapsed time in order to compute my own performance and the arithmetic intensity. However when I check the Self GFlop of a non terminal function I have found different results when looking at different views in the Intel Advisor GUI.
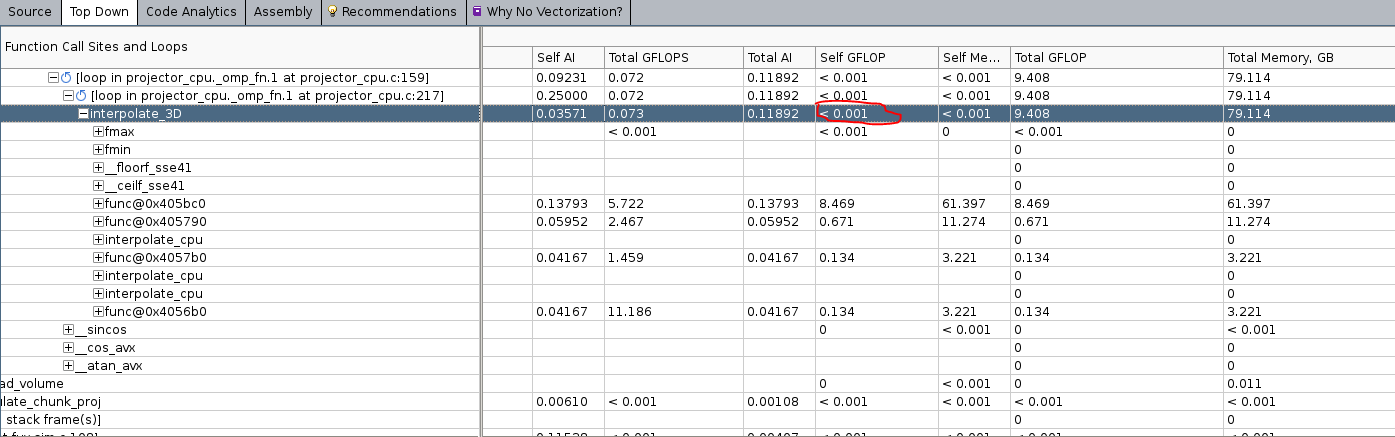
In topdown view I obtain a very small number of Self GFlop (< 0.001) for the function interpolate_3D. When I just select that function and click on the Code Analytics tab then the Self GFlop is 3.3544. Are they different metrics? Am I missing something?
I am using Intel Advisor 2018 Update 3.
.png)
Link Copied
- Mark as New
- Bookmark
- Subscribe
- Mute
- Subscribe to RSS Feed
- Permalink
- Report Inappropriate Content
Hi,
Let me double check with our dev team. I'll respond shortly.
Regards,
Kevin
- Mark as New
- Bookmark
- Subscribe
- Mute
- Subscribe to RSS Feed
- Permalink
- Report Inappropriate Content
Is it possible for you to send us the result directory so we can investigate. It may be that the flops for this function are being attributed to one of the callee's. Would you mind filing a ticket at https://supporttickets.intel.com.
Thanks!
- Mark as New
- Bookmark
- Subscribe
- Mute
- Subscribe to RSS Feed
- Permalink
- Report Inappropriate Content
Ok, I have done it. Thank you for your fast answer.
- Mark as New
- Bookmark
- Subscribe
- Mute
- Subscribe to RSS Feed
- Permalink
- Report Inappropriate Content
Hi Estefania,
Could you please check the Self FLOP value from the "upper" side of Survey view, where the tool shows you the list of all loops and functions as a linear list? (sometimes it's called Loops/Functions list or "bottom-up view")
Also, is this possible that given function is invoked in multiple places? is this possible it is invoked recursively?
Upper Loops/Functions list view (and code analytics as well) give you aggregated metrics for given function across all places where it is invoked.
The Top-Down rows may show you individual instance of given function - the one which was invoked in the given call chain/stack frame/context. It could be the case that given interpolate function is invoked somewhere else in the program sub-tree which you captured at the second screen-shot. One way to check it is to expand the whole sub-tree (with fresh Advisor you right click on the row in top-down and choose expand sub-tree) and search (Ctrl+F) across the tree. Or even better method: you click on the function in "bottom-up" and the tool should normally auto-expand all instances of this function in Top-Down.
Thanks!
- Subscribe to RSS Feed
- Mark Topic as New
- Mark Topic as Read
- Float this Topic for Current User
- Bookmark
- Subscribe
- Printer Friendly Page