- Mark as New
- Bookmark
- Subscribe
- Mute
- Subscribe to RSS Feed
- Permalink
- Report Inappropriate Content
We are trying to obtain the dynamic instruction mix of a scalar program with Intel Advisor 2021.4. We are following the steps of the documentation:
$ advisor --collect=survey --project-dir=./advi_results -- ./myApplication
$ advisor --collect=tripcounts --flop --project-dir=./advi_results -- ./myApplication
$ advisor --report=survey --mix --project-dir=./advi_results
Find attached the obtained instruction mix for our program.
The total number of instructions executed (Dynamic all_instructions) matches the total number of instructions retired shown in Vtune (INST_RETIRED.ANY). However, we need more specific counters, like the number of loads and stores, integer instructions, etc. If we compare the summation of specific counters with the total number of instructions, the difference is gigantic. Example for the most time-consuming loop (ID=4):
Dynamic all_instructions (72001491120) != Dynamic compute (9600198816) + Dynamic memory (25600530176) => 72001491120 (100%) != 35200728992 (48%)
Dynamic memory (25600530176) != Dynamic loads (11200231952) + Dynamic Stores (4800099408) => 25600530176 (100%) != 16000331360 (62.5%)
This mismatch makes us think that there are some counters that are not shown in the report.
Link Copied
- Mark as New
- Bookmark
- Subscribe
- Mute
- Subscribe to RSS Feed
- Permalink
- Report Inappropriate Content
Hi,
Thank you for posting in Intel Communities.
We recommend you to view the report in GUI for a detailed analysis, instead of viewing the report in command line.
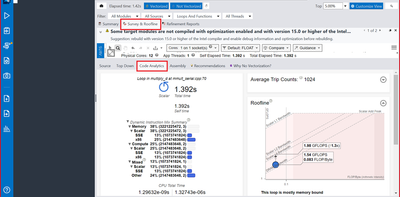
You can view the Dynamic Instruction Mix Summary in the GUI under code Analytics tab (which is highlighted in the screenshot).
From the image attached below, you can see that :
Dynamic all_instructions (100%) = Memory + Compute+ Mixed +Other
Advisor 2021.4 is available for download as a standalone tool at https://www.intel.com/content/www/us/en/developer/articles/tool/oneapi-standalone-components.html#advisor
or as part of oneAPI Base Toolkit 2021.4 at https://software.intel.com/content/www/us/en/develop/tools/oneapi/base-toolkit/download.html
Regarding the Dynamic Memory we will check and let you know.
Could you please let us know why are you trying to get this information and how would it help you?
Thank You
- Mark as New
- Bookmark
- Subscribe
- Mute
- Subscribe to RSS Feed
- Permalink
- Report Inappropriate Content
Hi,
Sorry for the inconvenience, we are working internally to find about dynamic memory.
Meanwhile, could you please let us know why are you trying to get this information and how would it help you?
Thank You.
- Mark as New
- Bookmark
- Subscribe
- Mute
- Subscribe to RSS Feed
- Permalink
- Report Inappropriate Content
Thank you very much for your help.
We are characterizing the performance of several HPC applications in two different machines. To understand the difference in performance between both machines, we find it very useful to have the instruction mix of each application in each machine.
- Mark as New
- Bookmark
- Subscribe
- Mute
- Subscribe to RSS Feed
- Permalink
- Report Inappropriate Content
Hi,
Thank you for providing us the details. We are working on this internally.
Thank You.
- Mark as New
- Bookmark
- Subscribe
- Mute
- Subscribe to RSS Feed
- Permalink
- Report Inappropriate Content
Hi Lorien,
As of now the text report does not contain all the instruction counts. We plan to include this going forward. Please use GUI code assembly pane for now. Below few points might be helpful for you:
- “Other” instructions often include control-flow instructions, for example: INC (increments), CMP(compare), JB (jump). Hence you can try to review “Assembly” pane for the loops and functions of interest to check if there are such instructions
- If you are interested in more detailed tables with instructions, you can use our PythonAPI example for creating your own instruction mix report on Python, that will include the necessary categories by their types and sub-types (vector/scalar, operand types, ISA…): Intel_Advisor_2022.0\pythonapi\examples\custom_mix.py.
Regarding the mismatch in memory instructions - can you please provide a reproducer?
- Mark as New
- Bookmark
- Subscribe
- Mute
- Subscribe to RSS Feed
- Permalink
- Report Inappropriate Content
Thank you for the information.
To reproduce the mismatch in memory instructions you can use this application: https://github.com/smarco/WFA To compile and run:
cd WFA-master
make # Compile the application
./bin/generate_dataset -n 500000 -l 100 -e 0.05 -o sample.dataset.seq # Generate input dataset
# Generate instruction-mix report
advixe-cl --collect=roofline --flop --project-dir=./advisor_results -- ./bin/align_benchmark -i sample.dataset.seq -a gap-affine-wfa
advixe-cl --report=survey --mix --project-dir=./advisor_results
- Mark as New
- Bookmark
- Subscribe
- Mute
- Subscribe to RSS Feed
- Permalink
- Report Inappropriate Content
Thanks for the reproducer. We have similar findings as of you. I have logged bug for this case and I shall keep you posted on the fix.
- Mark as New
- Bookmark
- Subscribe
- Mute
- Subscribe to RSS Feed
- Permalink
- Report Inappropriate Content
Hi,
Good day to you.
Sorry for the delay in getting back to you.
Thank you for sending us your recommendation for Intel Advisor. We have decided to close this issue at this time since it is clear that we will not be implementing this particular request/fix in the near future. Your request will be kept on record in our database. We will continue to review this request and all other feature requests each year during planning for the next major release of the product. Your feedback and suggestions are important to us. Thank you for sending us this request to improve our product.
Intel will no longer monitor this thread. Kindly post a new question if you need any assistance with Intel products and services.
Regards,
Jyothis V James
- Subscribe to RSS Feed
- Mark Topic as New
- Mark Topic as Read
- Float this Topic for Current User
- Bookmark
- Subscribe
- Printer Friendly Page
