- Mark as New
- Bookmark
- Subscribe
- Mute
- Subscribe to RSS Feed
- Permalink
- Report Inappropriate Content
Hello Team,
I am using Intel Inspector for a small design which takes around 2 hours to complete.
Right now I am running the same task in Intel inspector and its been 48 hours and the result is still not generated.
What changes should I make ?
Regards,
Akhilesh
- Mark as New
- Bookmark
- Subscribe
- Mute
- Subscribe to RSS Feed
- Permalink
- Report Inappropriate Content
Hi Akhilesh,
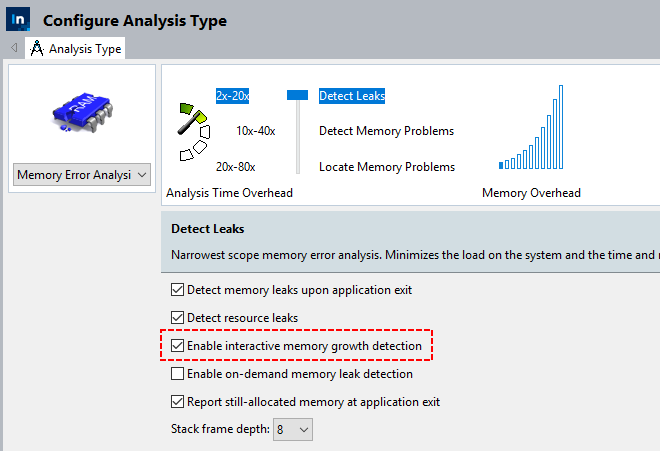
Intel Inspector analysis has big overhead in comparison to native application execution. Exact slowdown depends on selected analysis options and application code execution. To have reasonable analysis time, it is better to select smaller workloads sufficient to trigger correctness problem.
In some cases, added overhead also triggers algorithmic issues that don’t show up during native execution (e.g. timeouts, threads ordering, memory blocks allocation layout). Running both threading- and memory- analysis on the same workload could help to locate those problems.
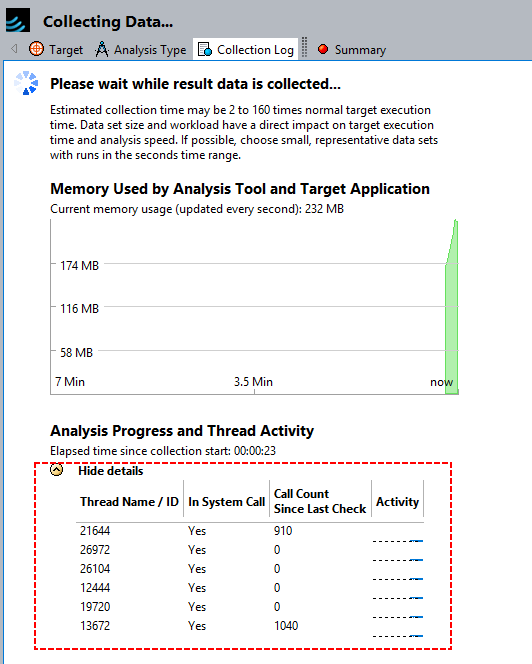
Intel Inspector GUI has real-time chart of running application. Its details section has table of active application threads that might help to distinguish application hang from analysis overhead with a certain level of confidence. E.g. having thread inside if system call and zero calls since last check, might be a sign that it is waiting on some lock.
Link Copied
- Mark as New
- Bookmark
- Subscribe
- Mute
- Subscribe to RSS Feed
- Permalink
- Report Inappropriate Content
Hi,
Thank you for reaching out. Could you please share with us the following details, so that we can analyze the issue?
1. Inspector version
2. The OS you are using and its version
3. Minimal sample reproducer code
4. Steps followed to reproduce the issue from our end
5. Steps followed to compile and build
6. Options set in inspector gui
7. Relevant screenshots.
Regards
Gopika
- Mark as New
- Bookmark
- Subscribe
- Mute
- Subscribe to RSS Feed
- Permalink
- Report Inappropriate Content
Hi Gopika,
PFB the required details.
using the latest version on OS redhat 6.7. I did a detect memory problems analysis for my code.
I am running a big design so can not provide you a sample reproducer code.
Regards,
Akhilesh
- Mark as New
- Bookmark
- Subscribe
- Mute
- Subscribe to RSS Feed
- Permalink
- Report Inappropriate Content
Hi Akhilesh,
Intel Inspector analysis has big overhead in comparison to native application execution. Exact slowdown depends on selected analysis options and application code execution. To have reasonable analysis time, it is better to select smaller workloads sufficient to trigger correctness problem.
In some cases, added overhead also triggers algorithmic issues that don’t show up during native execution (e.g. timeouts, threads ordering, memory blocks allocation layout). Running both threading- and memory- analysis on the same workload could help to locate those problems.
Intel Inspector GUI has real-time chart of running application. Its details section has table of active application threads that might help to distinguish application hang from analysis overhead with a certain level of confidence. E.g. having thread inside if system call and zero calls since last check, might be a sign that it is waiting on some lock.
- Mark as New
- Bookmark
- Subscribe
- Mute
- Subscribe to RSS Feed
- Permalink
- Report Inappropriate Content
Hi,
We have not heard from you. Did the response provided by Michael_T resolve your query? Can we discontinue monitoring this thread?
Regards
Gopika
- Mark as New
- Bookmark
- Subscribe
- Mute
- Subscribe to RSS Feed
- Permalink
- Report Inappropriate Content
Hi,
Thank you for accepting Michael_T's response as a solution. If you need any additional information, please submit a new question as this thread will no longer be monitored.
Regards
Gopika
- Subscribe to RSS Feed
- Mark Topic as New
- Mark Topic as Read
- Float this Topic for Current User
- Bookmark
- Subscribe
- Printer Friendly Page