- Mark as New
- Bookmark
- Subscribe
- Mute
- Subscribe to RSS Feed
- Permalink
- Report Inappropriate Content
Hi all,
I'm profiling a numerical model (+OpenMP) using the Intel Vtune advanced hot-spot (default) method.
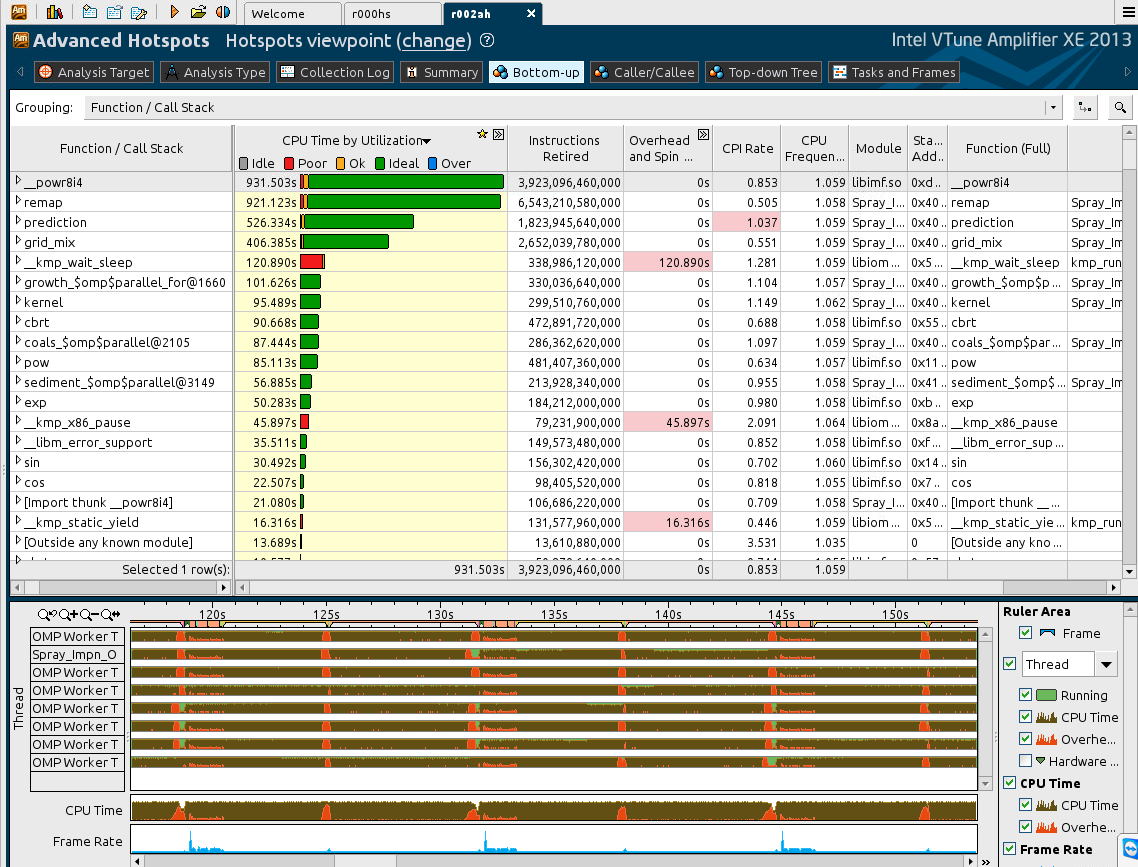
The results shows that the KMP_ variables : KMP_WAIT_SLEEP ; KMP_X86_PAUSE ; KMP_STATIC_YIELDS, have a non-negligible overhead time.
In addition, another subroutine (PREDICTION) is shown to have a relatively large CPI (Pls. see the attach PNG).
My kind questions to you guys : how can/should I proceed in reducing the over-head time of these KMP_ variables? What is more important, Over-head time or CPI - how to lower the CPI time ? Are there anymore more options that I miss based on the attached results ?
Appreciate in advance your answers,
Jacob.
Link Copied
- Mark as New
- Bookmark
- Subscribe
- Mute
- Subscribe to RSS Feed
- Permalink
- Report Inappropriate Content
Hello Jack,
CPU time on the pointed KMP_ functions usually means that OpenMP worker threads are spinning in a wait burning the CPU. According to the picture attached there might be imbalance on OpenMP region barriers. If you use loop work sharing constructs you can play with scheduling clauses to improve the imbalance e.g.:
#pragma omp for schedule(dynamic)
By the way - if you expand the overhead column - it will be broken down to overhead and spin sub-columns with its own column description and hints on issues - cells colored by pink.
High CPI rate can be a symptom on different kind of problems - memory stalls, instruction starvation, branch misprediction or long latency operations. To explore more on this you can try "General Exploration" microarchitecture analysis that might help to categorize the issue.
I would start with the imbalance since simple schedule change can lead to immediate performance improvement. You can also explore top hotspots drilling down to source view and see on opportunities for algorithmic tuning for most CPU consuming source lines. And then microarchitecture analysis of functions with high CPI.
Thanks & Regards, Dmitry
- Mark as New
- Bookmark
- Subscribe
- Mute
- Subscribe to RSS Feed
- Permalink
- Report Inappropriate Content
The work imbalance exhibited in your graph looks quite small and not local to any one thread, so it may not be possible to make a significant reduction.
Guessing that you may have a fair number of avx256 instructions, CPI of around 1.0 could hardly be characterized as "high." In such a case, you could substitute instructions which perform less work per instruction (by disabling vectorization or changing instruction set) so as to reduce CPI, if you don't care about increasing run time. As Dimitry said, VTune general exploration could be useful to see whether there is any specific performance issue.
Perhaps a more likely route would be to investigate whether your source code might be changed to cut down on power function calls and so on.
- Mark as New
- Bookmark
- Subscribe
- Mute
- Subscribe to RSS Feed
- Permalink
- Report Inappropriate Content
@TimP and @DimitriP :
Thanks very much guys!
The DYNAMIC clause is hardly affecting the work imbalance; It might be because most of the outer loops-counter data sharing are fixed in size in my source code - I might need to use more conditional work-sharing (i.e., DO-WHILE) in order to get more pronounced effect.
As for the AVX256 suggestion (or instruction starvation as @DimitriP call it) - its new to me, however I do care about increasing the run time (its already 2.5-3 days with the current source code, and I'm polishing it). So might be, it would be a good practice to maximize the vectorization calculations over the source code, in hope it will produce more instructions.
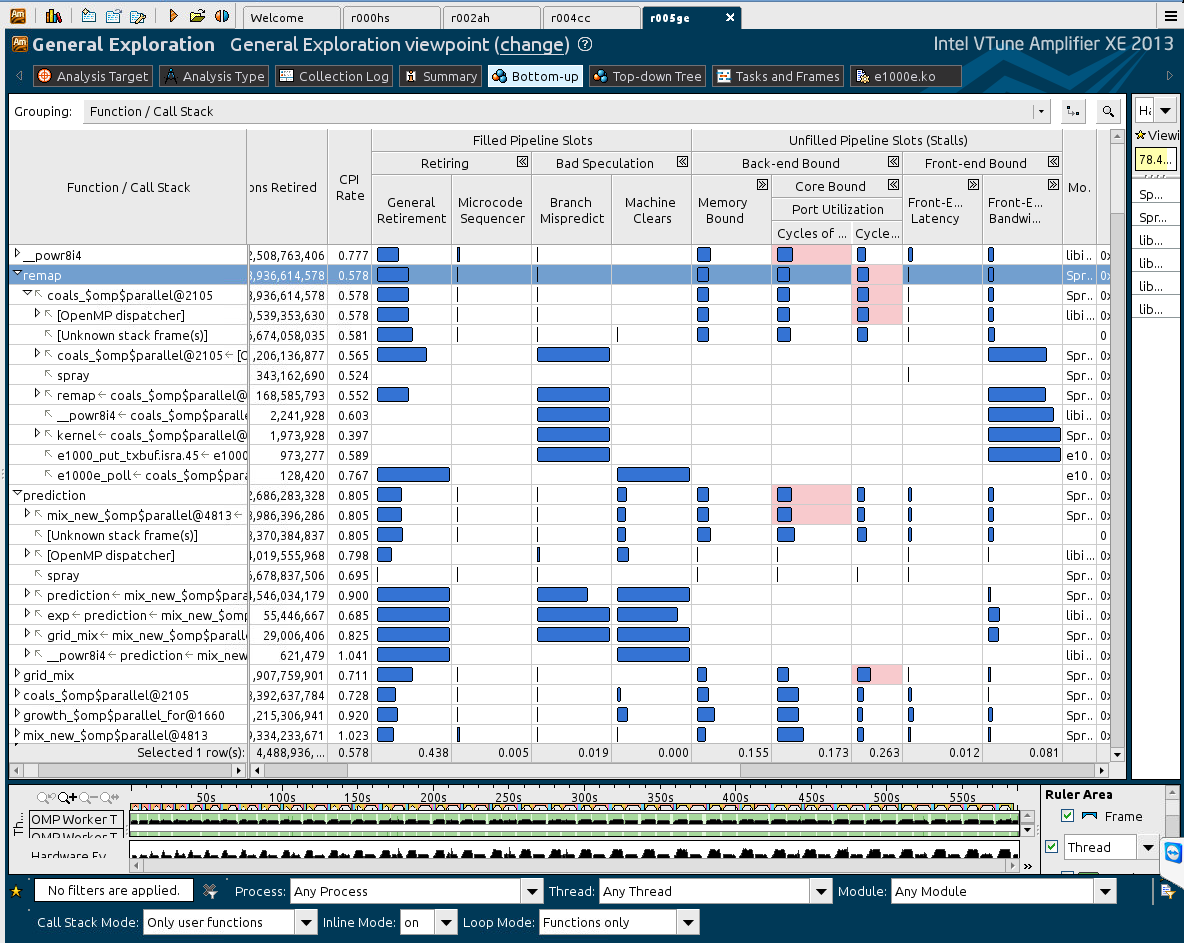
I attached the ''General Examination'' results with ~1000s of the model (ALL subroutine and functions were called multiple times) for your kind inspection.
In tried to open all the fields in the Vtune-gui results. What do you think, Which plausible route should I take with respect to these results ?
Are you guys familiar with an adequate tutorial to analyze these GE results ? (Maybe you guys in Intel (forum administrates) can share with us one of your targeted tutorials - or update the current OpenMP profiling tutorial (Kiril Rogozin if I'm not mistaken) with some GE information ?)
Thanks again,
Jacob.
- Mark as New
- Bookmark
- Subscribe
- Mute
- Subscribe to RSS Feed
- Permalink
- Report Inappropriate Content
In your last screenshot five functions are Front-End bounded with high number of branch mispredictions their CPI is not high < 1.0.I think that low CPI could be due to data being fetched from higher level caches.
- Mark as New
- Bookmark
- Subscribe
- Mute
- Subscribe to RSS Feed
- Permalink
- Report Inappropriate Content
Thanks @iliyapolak
I'm not really familiar with the term ''branch mispredictions'' - can you give me a lead on how should I overcome from data to being fetched from higher level caches ?
Thanks again,
Jack.
- Mark as New
- Bookmark
- Subscribe
- Mute
- Subscribe to RSS Feed
- Permalink
- Report Inappropriate Content
Hi Jack
>>>can you give me a lead on how should I overcome from data to being fetched from higher level caches ? >>>
This is only my assumption.I do not know the source code of those five functions which are Front-End bounded and when I looked at the result of VTune analysis my first thought was that data is being fetched from the L2D cache because of the very low CPI ratio.I do not exclude the other cause not related to the memory fetches of the code.
Can you post more detailed picture of the Front-End stalls analysis?
Explanation of branch prediction and branch misprediction.
http://en.wikipedia.org/wiki/Branch_prediction
http://en.wikipedia.org/wiki/Branch_misprediction
Simple example of successful branch prediction could be for-loop where backward conditional jump will be taken.
Simple example of the branch misprediction could be a conditional jump on outcome of some pseudo-random calculation..
- Subscribe to RSS Feed
- Mark Topic as New
- Mark Topic as Read
- Float this Topic for Current User
- Bookmark
- Subscribe
- Printer Friendly Page