- Mark as New
- Bookmark
- Subscribe
- Mute
- Subscribe to RSS Feed
- Permalink
- Report Inappropriate Content
Hi,
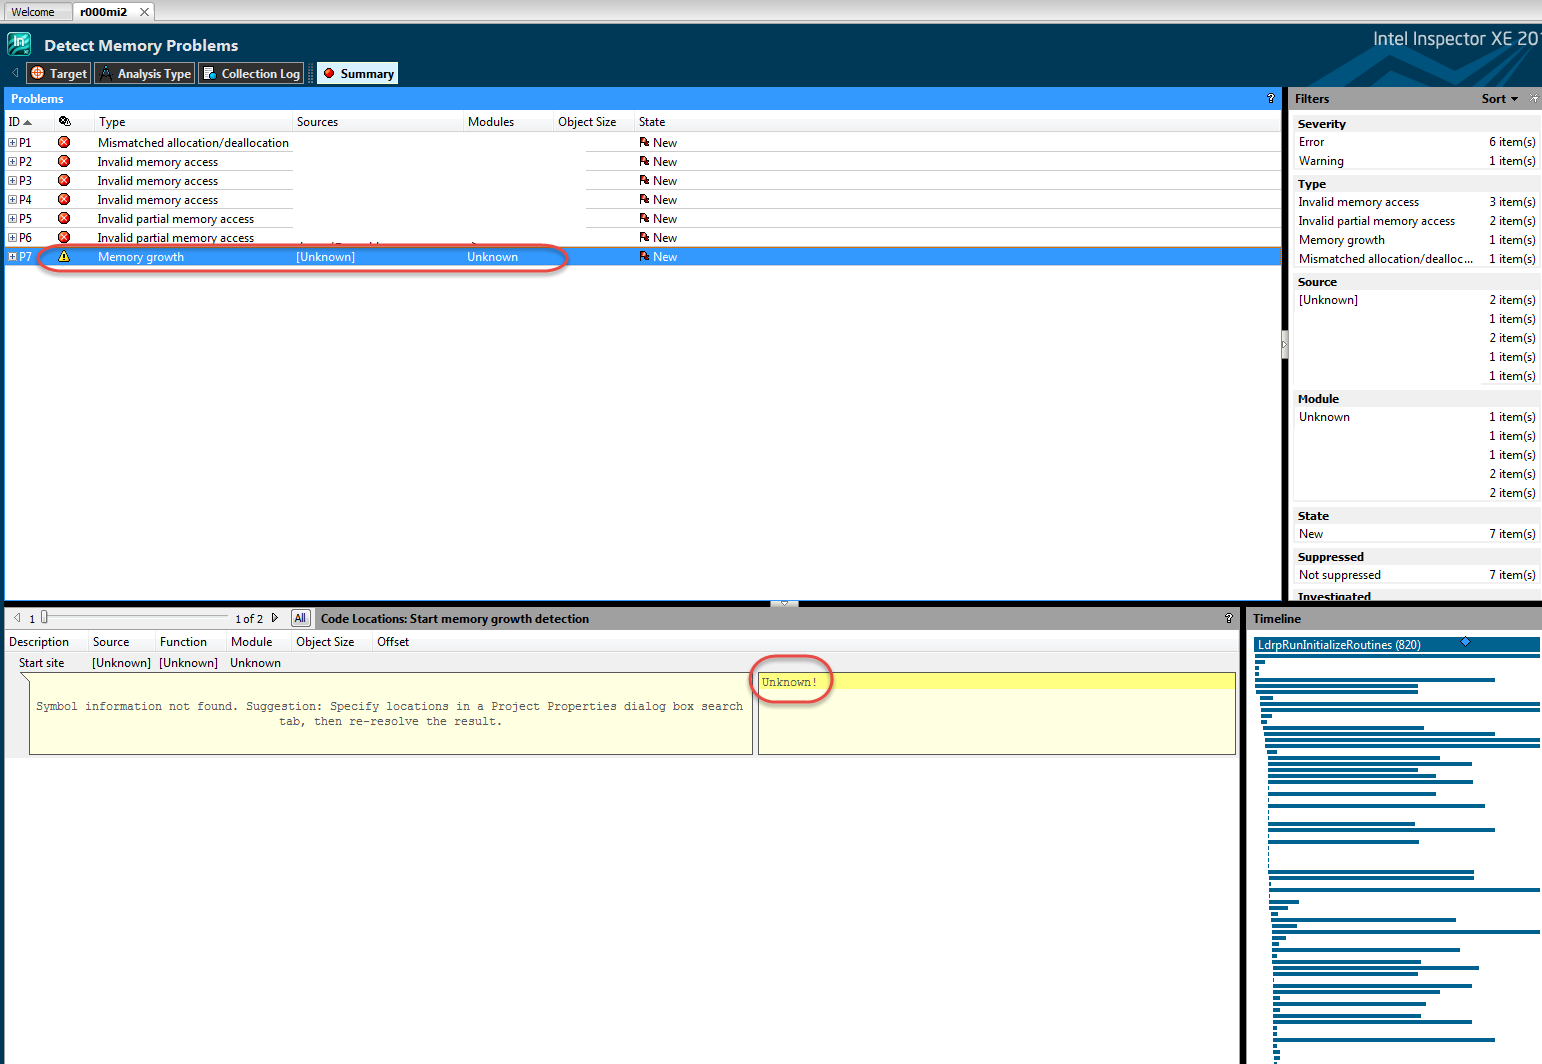
the memory growth analysis would be very useful to find growth-related problems in our software. I have tested it several times now, but the result was always the same: I got 1 memory growth problem found, and this was reported as "Unknown", so it just tells me nothing about the underlying problem(s) (see screenshot).
In which cases does the tool report "unknown"? (Perhaps this helps me finding out what is going wrong...)
What I did:
- new project
- in project properties, disabled "enable collection progress information" because this seemed to hook up Inspector during some analyses
- set binary/symbol paths
- detect memory problems analysis:
- detect resource leaks
- enable interactive memory growth detection
- stack frame size: 32
- start
- after some time "reset growth tracking"
- performed transactions on my application...
- then pressed "measure growth"
- then "stop" => analysis shows "unknown" growth problem
Regards, Hagen
Link Copied
- Mark as New
- Bookmark
- Subscribe
- Mute
- Subscribe to RSS Feed
- Permalink
- Report Inappropriate Content
Hi Hagen - What do you get when you expand the node?
- Mark as New
- Bookmark
- Subscribe
- Mute
- Subscribe to RSS Feed
- Permalink
- Report Inappropriate Content
- Mark as New
- Bookmark
- Subscribe
- Mute
- Subscribe to RSS Feed
- Permalink
- Report Inappropriate Content
Okay, thanks. I will report this to our engineering team. For now, I think you can ignore that because these are really just markers for the start and end of the growth analysis. When your symbol and source paths are set properly, and you have traceable growth happening in your application between these time markers, you should be getting richer information with the debug info. However, what you have now is no-growth detected and so you only see the markers, which is a bit confusing I think.
- Mark as New
- Bookmark
- Subscribe
- Mute
- Subscribe to RSS Feed
- Permalink
- Report Inappropriate Content
Hello,
we are also experiencing gradual, "unlimited" memory growth. I tried Intel Inspector; using Fortran Code compiled with Intel Composer XE 2013, using the compile flags
/debug /check:bounds.
Is it important to mention that a DLL is loaded dynamically? That works, the program runs well with the DLL loaded - apart from the aforementioned memory problems.
Intel Inspector (trial version 2015 SP2) does give me alerts: 2 times "Kernel resource leak" and 3 times "Invalid partial memory access".Analysis method was Memory Error Analysis with all options selected but one (the one "not recommended": Revert to previous uninitialized memory algorithm)
HOWEVER
It tells me: "Symbol Information not found. Suggestion: Specify locations in a Project Properties dialog box search tab, then re-resolve the result".
2 points I am not getting: I frankly believed that Inspector shows me the locations where problems arise, not the other way around :) I thought this is what the software is for. Obviously I must be missing a point here (but still I am stuck with the memory problems). I did in fact try to "specify locations ..." as suggested (or so I believe). The source code is in one directory and I was only able to specify a directory - not a single source file - so I offered that one directory. Or can I in fact suggest source locations aka files or even subroutines? Specifying the source directory brings no change. "Symbol Information Not Found" by Inspector.
What am I missing here? Is it as easy as other compile flags (I did not find any comprehensive information on which compile flags go specifically with an Inspector check just yet)
Can you help?
Thanks in Advance!
-Olaf
- Mark as New
- Bookmark
- Subscribe
- Mute
- Subscribe to RSS Feed
- Permalink
- Report Inappropriate Content
Hi Olaf,
when Inspector is missing "symbols", you should
- make sure that you create symbol files (*.pdb on Windows) when you compile your software - for each compiled DLL you should have a separate PDB file
- tell Inspector the directory / directories where it can find those PDB files
Regards, Hagen
- Mark as New
- Bookmark
- Subscribe
- Mute
- Subscribe to RSS Feed
- Permalink
- Report Inappropriate Content
Dear Hagen,
I do appreciate your quick reply.
Essentially, I have done (and had done before) exactly what you described - except I referred only to "source directory" in my question above, but specified the same directory for binary symbols as well: In this case, source and binary files (including .pdb) are all in one directory, and I specified it in Inspector in the "Project Properties".
Please see screenshot to determine, whether I am doing the right thing.
Still, Inspector says "Symbol information not found". (FYI: The application's "run" directory is different, but anything that is part of the build is in the directory described).
So I must have given the right information to Inspector ..... or so I believe.
So far, memleaks still there and they are not located by Inspector. Any other idea as to what I could do? Just for testing/fixing purposes: Is it beneficial to get rid of the "dynamic loading of DLL" and do static loading? Or - since I have the DLL source code as well - to (temporarily) get rid of DLL binding alltogether and fully link the object when building the executable (I will need DLLs at at later time, due to interaction with customers)?
What I want to ask is: If I "compile/link it into" the main exe and then fix memleaks, if any (hopefully found by Inspector): Does that help me in any way with the DLL setup (and I could then go back to DLLs once mem leaks are cleared out), or is that a completely different ball game and therefore my suggestion not helpful?
Once again, I very much appreciate and ideas.
Regards, Olaf

- Mark as New
- Bookmark
- Subscribe
- Mute
- Subscribe to RSS Feed
- Permalink
- Report Inappropriate Content
Hi Olaf,
I'm not sure about the influence of dynamic linking to this problem - maybe someone else knows anything? Just from my experience: I did several other analyses with Inspector which worked, even with using dynamic linking.
Concerning failing of pdb loading, you could check the following:
- Make sure that the pdb files really do match your compiled binary. (E.g. try to debug your code with wdexpress (Visual Studio debugger, there is a free version) - menu "debug / windows / modules" lists the pdb files which were successfully loaded. If wdexpress has a problem, Inspector will suffer from the same.)
Regards, Hagen
- Mark as New
- Bookmark
- Subscribe
- Mute
- Subscribe to RSS Feed
- Permalink
- Report Inappropriate Content
OK - SOLVED my issue. First of all, Inspector is really helpful. It pointed me to the memleaks.
I would like to state what happened - in order for others, who may also not do this everyday, to benefit from it. First of all: Yes, I did miss something. I had compiled all source files with /debug:full /check:bounds, but the linking command in the makefile did not contain these flags. As a result, Inspector could not locate the mem leaks. It can now. My bad of course, but I believe that could happen to others as well. So I'll gladly mention it
Regarding the actual memleak:
This is fortran code, which has compiled with a different vendor's compiler and run for 15 years with no mem leaks in a similar form, with some ongoing editing (as is typical for many fortran projects, I believe).
NOW - WHAT CAUSES MEMLEAKS?
I my case, it is calling a subroutine with arrays and array dimensioning integers as dummy arguments. This has always worked for us in the past. An example would be
call sub(array1,array2,MDIMa,MDIMb)
...
subroutine sub(array1,array2,MDIMa,MDIMb)
implicit none
integer :: MDIMa,MDIMb
real*8  :: array1(MDIMa,MDIMb),array2(MDIMa)
Similar calls cause Memleaks in SOME CASES - but not others. Our code - some 50000 lines - is full of all kinds of calls like that - only a few cause problems. But these must be eliminated, as they result in program crash - and make the program otherwise a "bad citizen" on my machine as well of course. And - as said - it has run for 15 years; maybe the old compiler cleaned up behind us. We are genuine mechanical engineers who program, but we are not thorrowbread programmers so to speak. So we are not completely in the know regarding this. But willing to learn.
The workaround was to put the dimensioning integers in some module, rather than passing them as dummy arguments, and then USE that module - that was it for a workaround.
Is there something that *has become* generally wrong with this approach (as mentioned, in earlier days you could code like that). We are willing to learn and to adapt to "modern Fortran life". If this includes some systematic way how to deal with this, I would like to know. For example, the order in which the variables/arrays are passed.
In any case: If you have ever had memory leak problems with your Fortran code, this could be a tip for you as well. And otherwise, for those programming pro's: I do appreciate any tip or correction as to how to approach these things. The best thing would be concise rules as to how these memleaks actually are created / can be avoided, so as to not have them to begin with (even though Inspector is a really nice tool).
Again, Thank you all for reading and helping out. And if this benefits somebody else - so much the better.
Regards, Olaf
(Note: The old compiler vendor had to be phased out with us, since it isn't modernized anymore; cannot cope with modern DLLs anymore - also, simple compile optimization on Intel has made our code twice as fast). Other than for the mem leaks, we like the Intel compiler quite a bit.
- Subscribe to RSS Feed
- Mark Topic as New
- Mark Topic as Read
- Float this Topic for Current User
- Bookmark
- Subscribe
- Printer Friendly Page