- Mark as New
- Bookmark
- Subscribe
- Mute
- Subscribe to RSS Feed
- Permalink
- Report Inappropriate Content
Hi,
I'm using Vtune to annalyse some AVX image processing routines I'm doing. I'm compiling with Visual Studio Pro 2012, and using the latest Vtune in 64bit C++ mode.
I have symbols turned on in my release mode, so I can see the functions in the Functions Grouping page just fine. But when I drill down into my function, most of the blocks in timings pane are empty except at the end of the loop where it increments some pointers.
For example.
For(some loop conditions)
{
Lots of AVX stuff
more AVX stuff
increment pointers <- Only timing blocks mentioned for this, which covers everything above.
}
I'm only getting CPU_CLK_UNHALTED_.THREAD timings next to the end of the loop pointer increments. Its as if it cant work out what source code maps to what assembly functions, which I find odd, as the AVX intrinsics map pretty much 1:1.
Is there anyway to improve this, other than looking at the assembler pane ?
thanks,
Richard.
Link Copied
- Mark as New
- Bookmark
- Subscribe
- Mute
- Subscribe to RSS Feed
- Permalink
- Report Inappropriate Content
Can post the screenshot of VTune analysis?
- Mark as New
- Bookmark
- Subscribe
- Mute
- Subscribe to RSS Feed
- Permalink
- Report Inappropriate Content
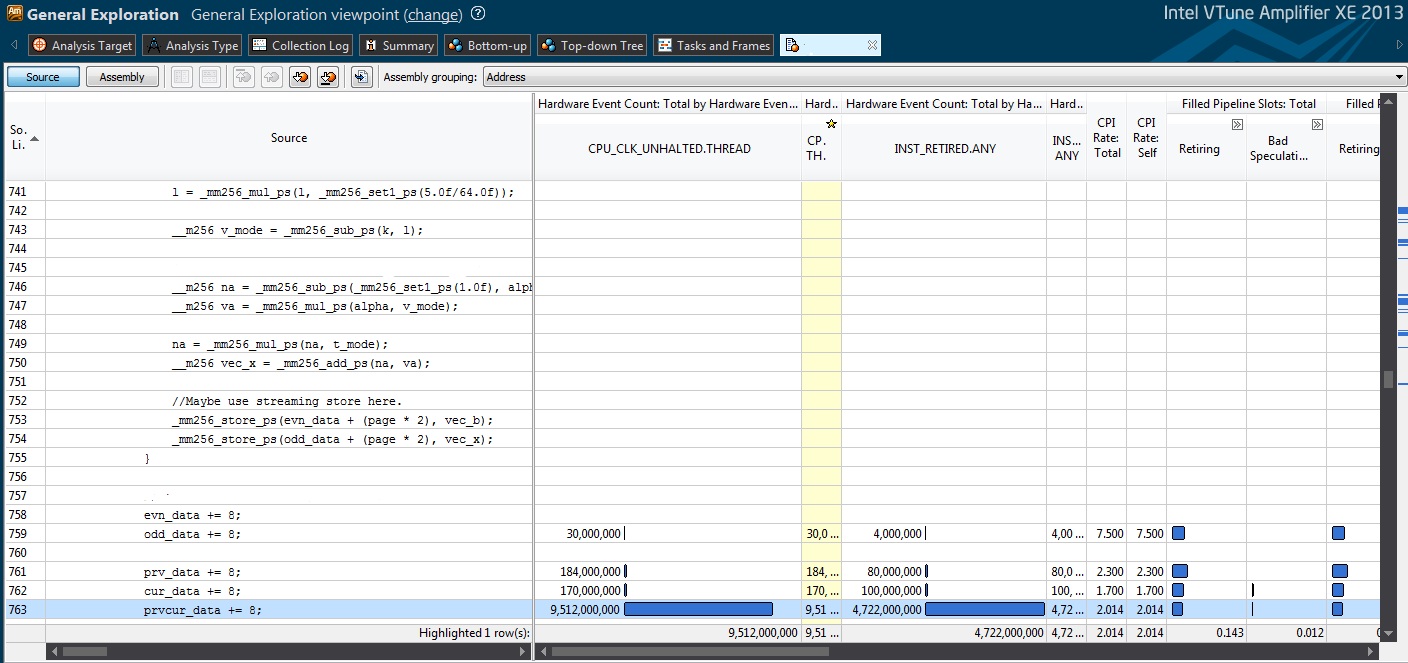
Sure, heres a screenshot. If I scroll up theres like 3 or 4 screens worth of code with nothing next to it in the timing results.
While I'm here, I've also noticed alot of the bars in the assembler pane seems to be way off as well, in terms of location to the offending asm instructions.
For example, in the summary it mentions Loads blocked by store forwarding issues, and 4K aliasing issues. However when I look at the assembler pane where it's showing these, its on register only assembler instructions which makes no sense. I'm wondering if its an Update 13 thing, as I'm sure Update 12 used to be more accurate regarding this kind of stuff.
- Mark as New
- Bookmark
- Subscribe
- Mute
- Subscribe to RSS Feed
- Permalink
- Report Inappropriate Content
It seems that pointer arithmetics is only measured.I cannot understand why intrinsic functions calls are not profiled.
Regarding "Loads blocked by store forwarding" issue think that your code perform loads hence pointers are incremented.Is your code performing some operation on the same value which is needed in the next iteration?For example:
for(some conditional statement) a[ix] = (double)ix*a[ix];
- Mark as New
- Bookmark
- Subscribe
- Mute
- Subscribe to RSS Feed
- Permalink
- Report Inappropriate Content
Heres a picture of what I mean. As you can see, half the instructions there are register to register, yet they have massive 4K alias, and Loads Blocked bars next to them. How can that possible be ? It looks like its just averaging out those issues over many instructions, no help at all in tracking down where they're coming from.
- Mark as New
- Bookmark
- Subscribe
- Mute
- Subscribe to RSS Feed
- Permalink
- Report Inappropriate Content
Hi Richard:
I'm sorry, but there was no picture attached to your last post. Can you show us the source view with assembly instructions displayed, as well?
- Mark as New
- Bookmark
- Subscribe
- Mute
- Subscribe to RSS Feed
- Permalink
- Report Inappropriate Content
@Richard
There is no any screenshot attached to your last post.
- Mark as New
- Bookmark
- Subscribe
- Mute
- Subscribe to RSS Feed
- Permalink
- Report Inappropriate Content
- Mark as New
- Bookmark
- Subscribe
- Mute
- Subscribe to RSS Feed
- Permalink
- Report Inappropriate Content
Hi
I looked at the screenshot and the results are strange indeed.The first two vmulps instructions and one vaddps they are register-register based,but maybe earlier operand registers were loaded from the memory hence "Loads Blocked ..." info is displayed on the results pane.Next code at addresses: 0x14005e249 -to-0x14005e25d could be potentially be source of "Loads Blocked due to Store Forwarding" message, but not any code line even those one which are referncing local stack variable.
- Mark as New
- Bookmark
- Subscribe
- Mute
- Subscribe to RSS Feed
- Permalink
- Report Inappropriate Content
One thing that would be useful is to turn off the bars and display actual values (right-click on a column and select "Display Data as ...").
Also, realize that there is such a thing as "event skid." Unless an event is "precise", and most are not, then by the time the processor is able to invoke the interrupt handler that records the EIP, execution has proceeded past the "offending" instruction. You can find more about that in the documentation.
What you should look at is which source line(s) appear to be generating these events and then examine the memory access pattern of your algorithm. VTune Amplifier does not track memory addresses, so you must examine your algorithm and use your knowledge of the data layout to determine if you are doing something less than efficient. For example, "load splits", are you aligning your data appropriately? That is, using appropriate compiler switches to keeps structure members aligned, etc.?
Ultimately, the best way to get help with this is to submit an issue at Intel® Premier Support and attach your zipped/tarred results directory.
- Mark as New
- Bookmark
- Subscribe
- Mute
- Subscribe to RSS Feed
- Permalink
- Report Inappropriate Content
Thanks for the input guys, when I get a spare moment I'll post back with some updates.
- Mark as New
- Bookmark
- Subscribe
- Mute
- Subscribe to RSS Feed
- Permalink
- Report Inappropriate Content
iliyapolak wrote:
Hi
I looked at the screenshot and the results are strange indeed.The first two vmulps instructions and one vaddps they are register-register based,but maybe earlier operand registers were loaded from the memory hence "Loads Blocked ..." info is displayed on the results pane.Next code at addresses: 0x14005e249 -to-0x14005e25d could be potentially be source of "Loads Blocked due to Store Forwarding" message, but not any code line even those one which are referncing local stack variable.
Hi,
The thing is, I was under the assumption that the main culprit of loads blocked due to store forwarding issues, is when you store something of X bytes, and then read it again of Y bytes. However in this case I am always reading and writing full 32 byte vectors. Also after looking at my algorithm I never read back what I calculate. That is to say, I have const sources that I read from, and destination buffers that are never read from. The only things that could be are intermediary calculations, but as I said these are always read and written in full 32 byte vector forms. Never split.
I will keep digging :)
- Mark as New
- Bookmark
- Subscribe
- Mute
- Subscribe to RSS Feed
- Permalink
- Report Inappropriate Content
Thanks for clearing this up.Without seeing source code and only looking at disassembled code it can be really confusing to get a clear picture of what could get wrong.Here I mean VTune analysis.
- Mark as New
- Bookmark
- Subscribe
- Mute
- Subscribe to RSS Feed
- Permalink
- Report Inappropriate Content
Hi Richard:
Which processor are you running this on? I can check with an expert about those events, but I need to know which processor, actually, which microarchitecture. But if you tell me the processor, I can figure that out.
- Mark as New
- Bookmark
- Subscribe
- Mute
- Subscribe to RSS Feed
- Permalink
- Report Inappropriate Content
Hi,
CpuZ reports it as Sandy Bridge Xeon E5-1607.
cheers,
- Mark as New
- Bookmark
- Subscribe
- Mute
- Subscribe to RSS Feed
- Permalink
- Report Inappropriate Content
Sorry. I didn't see your post last week. I'm checking on the events.
The other thing to look into, which I can't since I don't have the code, is how the debug info is being mapped. Did the compiler associated all the assembly instructions with those source lines? For example, in your assembly view, I see that all the instructions are attributed to line 516. What does the source code look like at line 516? It could be a matter of optimization.
- Mark as New
- Bookmark
- Subscribe
- Mute
- Subscribe to RSS Feed
- Permalink
- Report Inappropriate Content
Hi,
Line 516 is exactly the same as the line highlighted in my 1st picture upload. Its just the processing is split into two stages. 516 is the pointer increment part of the 1st stage.
Yes the problem seems to be that all the machine code is associated to very few lines of C++. I had full debug info turned on in VS, so not quite sure what this issue is. Perhaps VS finds it difficult to map AVX intrinsics generated code to the original source in the debug info.
I've identified where the 4K aliasing issue is coming from, cant do much about it without changing our memory data layout though. Something to look at for version 2 of the software :)
Does Sandybridge split 256bit vector reads or writes into 2 128bit reads or writes ? If so, could this internal splitting be the cause of loads blocked due to store forwarding ? Just thinking out loud here :)
- Mark as New
- Bookmark
- Subscribe
- Mute
- Subscribe to RSS Feed
- Permalink
- Report Inappropriate Content
Yes, when optimizing the compiler may reuse instructions for difference source code and this makes it difficult to follow the execution path.
Something else that I was reminded of by a colleague, is that it's best to look at the data in value form rather than the "bars". If you right-click on the column and select "Show data as...Counts" or "Counts and Bars", then you can see if the values are truly significant.
Otherwise, we are at a lose as well. If the compiler is generating the AVX instructions, there shouldn't be any data size mismatch. If you can create a sample loops that demonstrates this problem, that you could provide to us, we could look into it more.
- Mark as New
- Bookmark
- Subscribe
- Mute
- Subscribe to RSS Feed
- Permalink
- Report Inappropriate Content
Regarding the code disassembly at line 516 you can compare it with different dissasembler,but I do not think if it will help in case when pdb file is wrong.
- Subscribe to RSS Feed
- Mark Topic as New
- Mark Topic as Read
- Float this Topic for Current User
- Bookmark
- Subscribe
- Printer Friendly Page