- Mark as New
- Bookmark
- Subscribe
- Mute
- Subscribe to RSS Feed
- Permalink
- Report Inappropriate Content
Hi,
I have an application built with intel compilers (version 15) and -g -O2 mode (optim+debug info).
The application was run through amplxe-cl -collect hotspots.
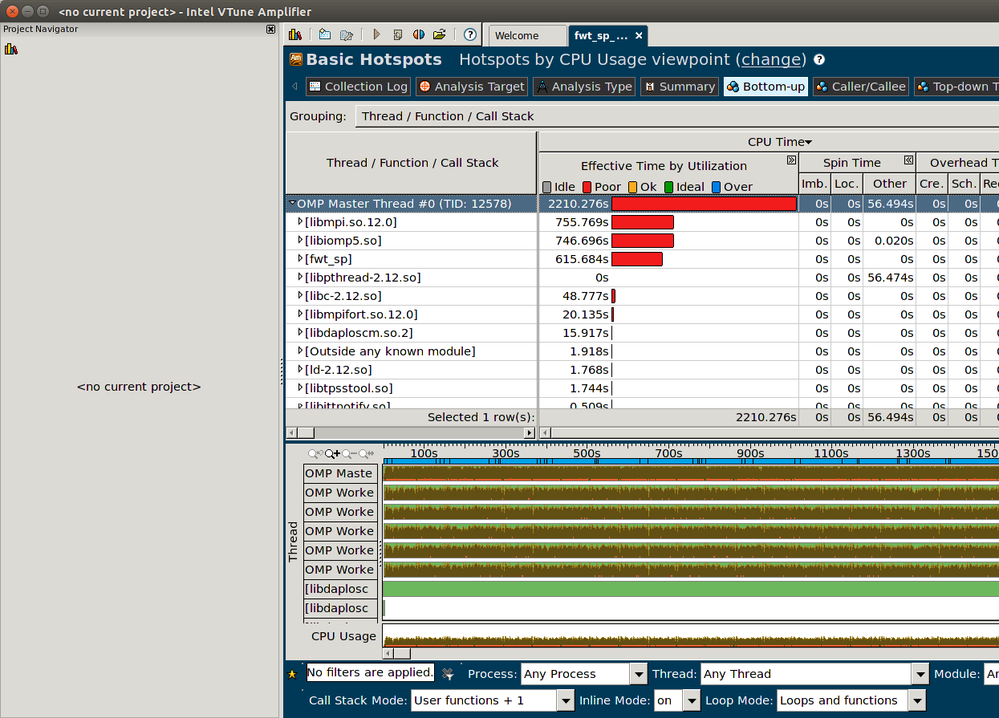
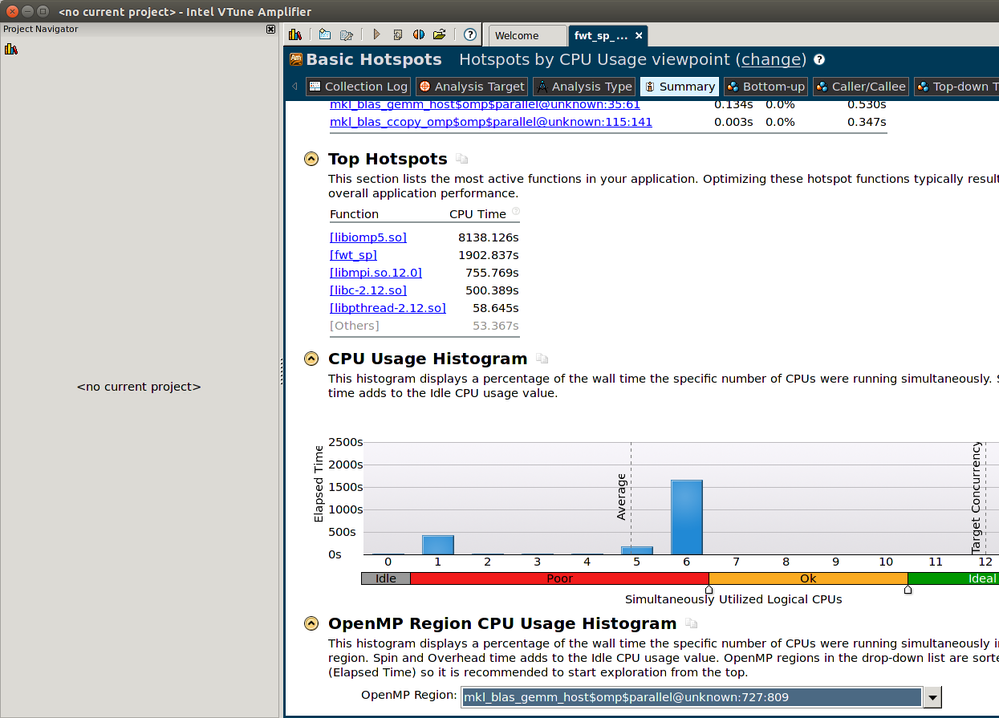
When lauchin VTune on the collected info, I would expect to find (as explained in a tutorial video) the time spent in the more time consuming function. Instead, I get:
Which is not really helpful.
Also, VTune seems a little bit confused with the concept of function vs library (see image below).
Is there an alternative to VTune do profile code compiled with Intel ? I just need the usual information, time spend in functions, loops, cache misses etc...
Regards
Link Copied
- « Previous
-
- 1
- 2
- Next »
- Mark as New
- Bookmark
- Subscribe
- Mute
- Subscribe to RSS Feed
- Permalink
- Report Inappropriate Content
Hello Alain,
So have you been able to finally get useful information on performance hotspots after the latest manupulations?
Regards, Dmitry
- Mark as New
- Bookmark
- Subscribe
- Mute
- Subscribe to RSS Feed
- Permalink
- Report Inappropriate Content
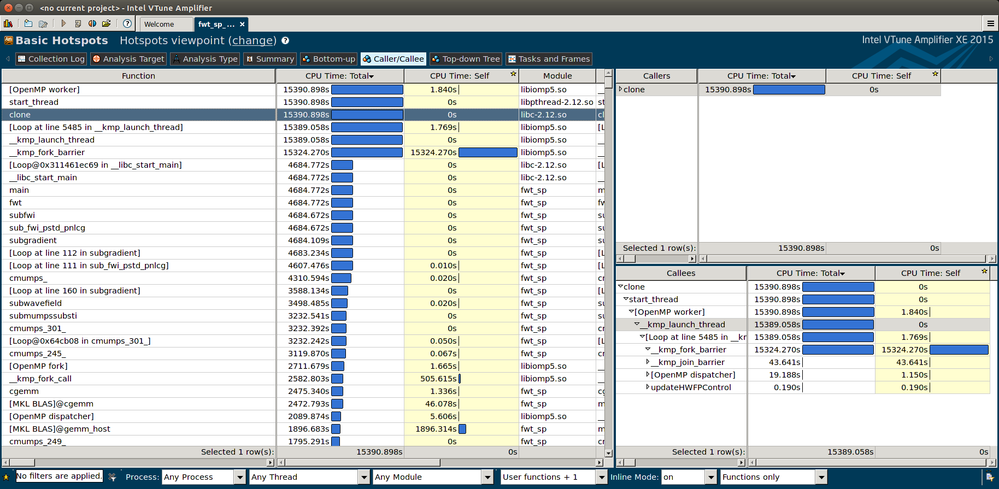
Well,it's getting better, I see functions now :). I wouldn't call them useful information so far, in the sense that I cannot do much out of them though.
I'm probably missing something. From the info I get, the master process (did not look at the others, but the master is probably the first one to look into in this case) we are spending _kmp_fork_barrier, but I cannot go back to the place in our code that triggers eventually those calls (probably just an oversight, but I couldn't find the number of calls either).
But I probably just need to find the right place in the doc.
- Mark as New
- Bookmark
- Subscribe
- Mute
- Subscribe to RSS Feed
- Permalink
- Report Inappropriate Content
Also, most of the time is spent outside of main, I suppose it is due to the fact that at some point, main ends up calling a multi threaded (through openmp) solver and that time spent in the 7 other thread is not accounted on the function spawning the thread ?
- Mark as New
- Bookmark
- Subscribe
- Mute
- Subscribe to RSS Feed
- Permalink
- Report Inappropriate Content
Hello Alain,
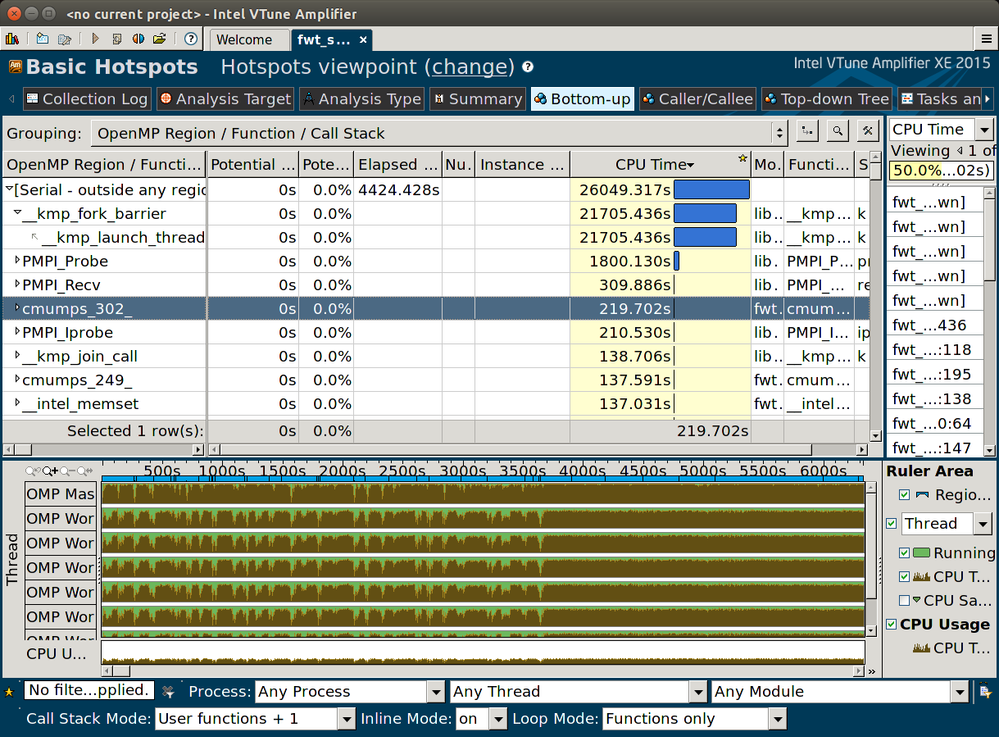
I would recommed to look at application with OpenMP with he help of "/OpenMP Regions/..." Bottom-Up pane grid grouping. If you use VTune Amplifier XE 2015 Update 1 it will help you to look at OpenMP inefficiency classification and potential gain (wall time) that you can have investing in fighting with this inefficiences. You can find details in: https://software.intel.com/en-us/node/529832.
BTW - what Intel compiler version do you use?
Thanks & Regards, Dmitry
- Mark as New
- Bookmark
- Subscribe
- Mute
- Subscribe to RSS Feed
- Permalink
- Report Inappropriate Content
The OpenMP Region grouping is not more helpfull. Time is spent in launching threads, but I cannot find a way to connect that to our code.
I am using ifort version 15.0.0
Thanks
- Subscribe to RSS Feed
- Mark Topic as New
- Mark Topic as Read
- Float this Topic for Current User
- Bookmark
- Subscribe
- Printer Friendly Page
- « Previous
-
- 1
- 2
- Next »


