- Mark as New
- Bookmark
- Subscribe
- Mute
- Subscribe to RSS Feed
- Permalink
- Report Inappropriate Content
Hi,
I am profiling an application using VTune (Update 16) and I can't understand some results.
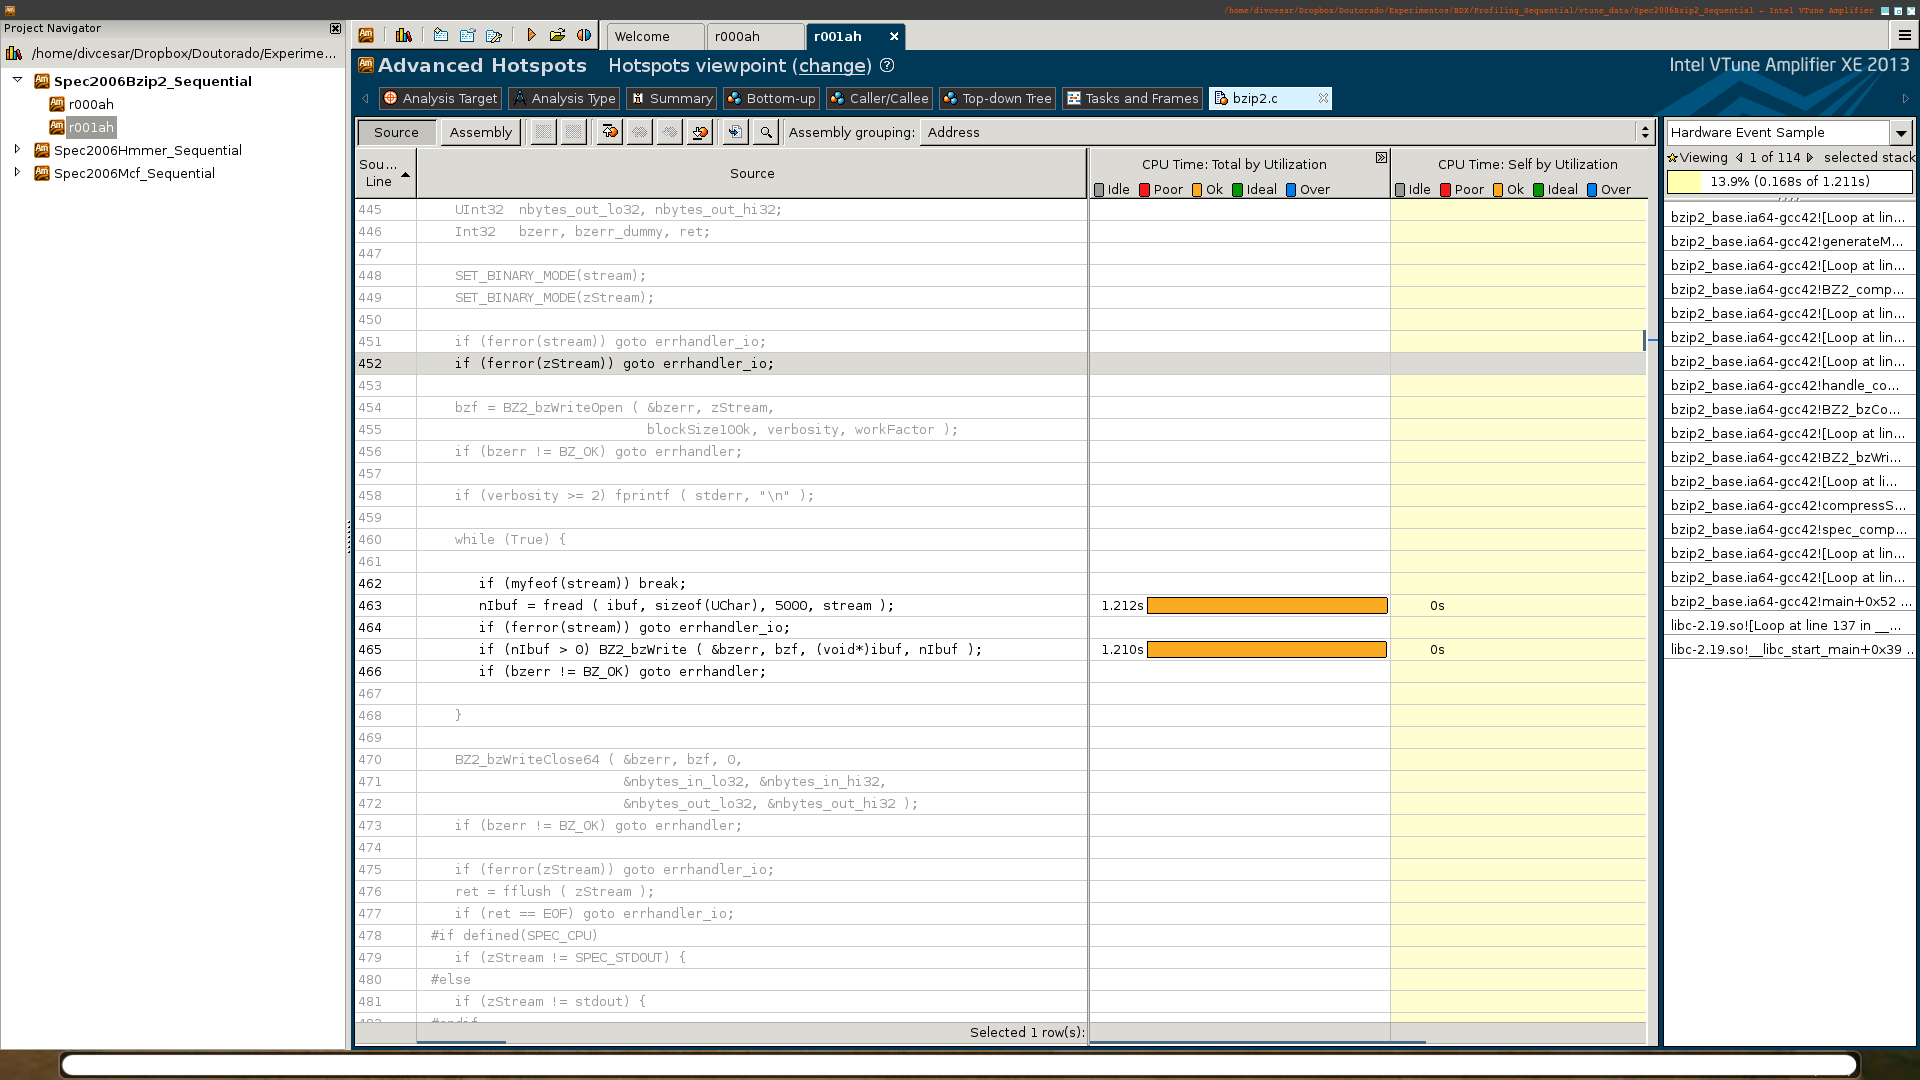
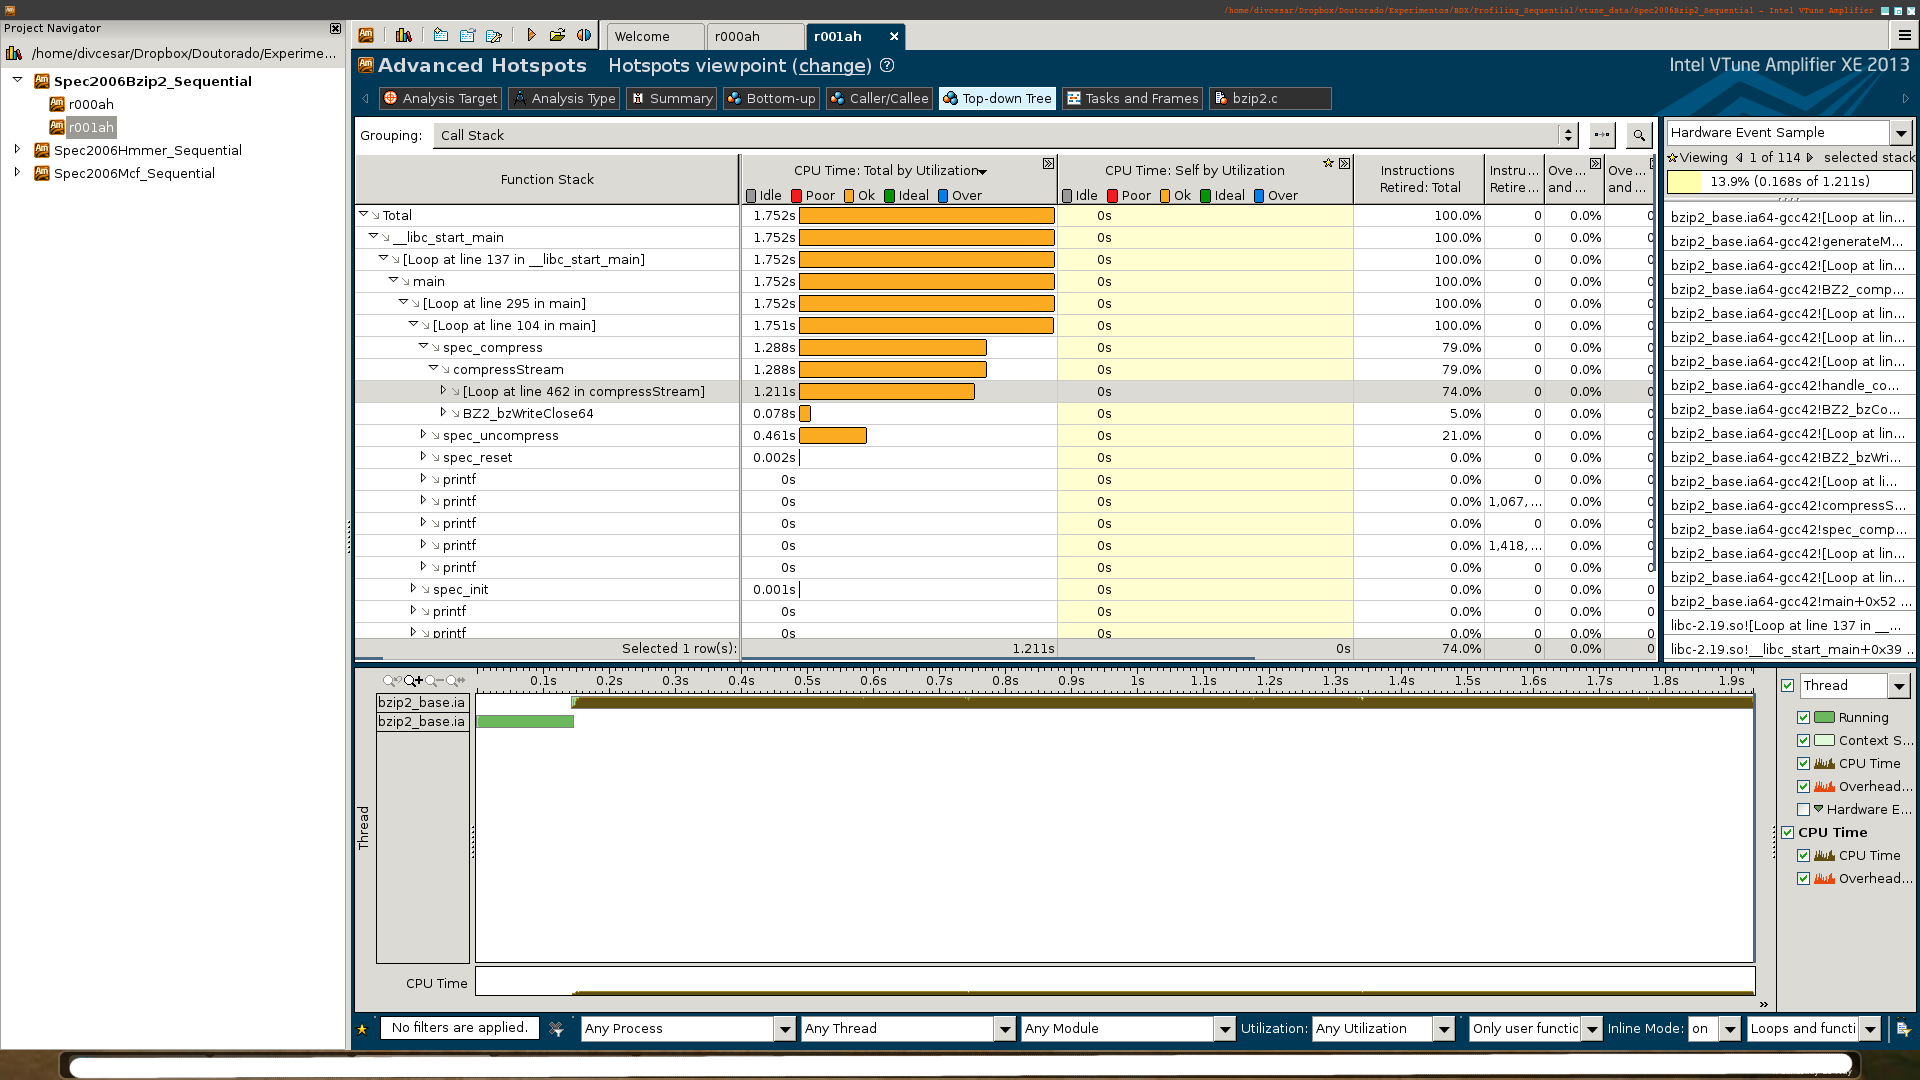
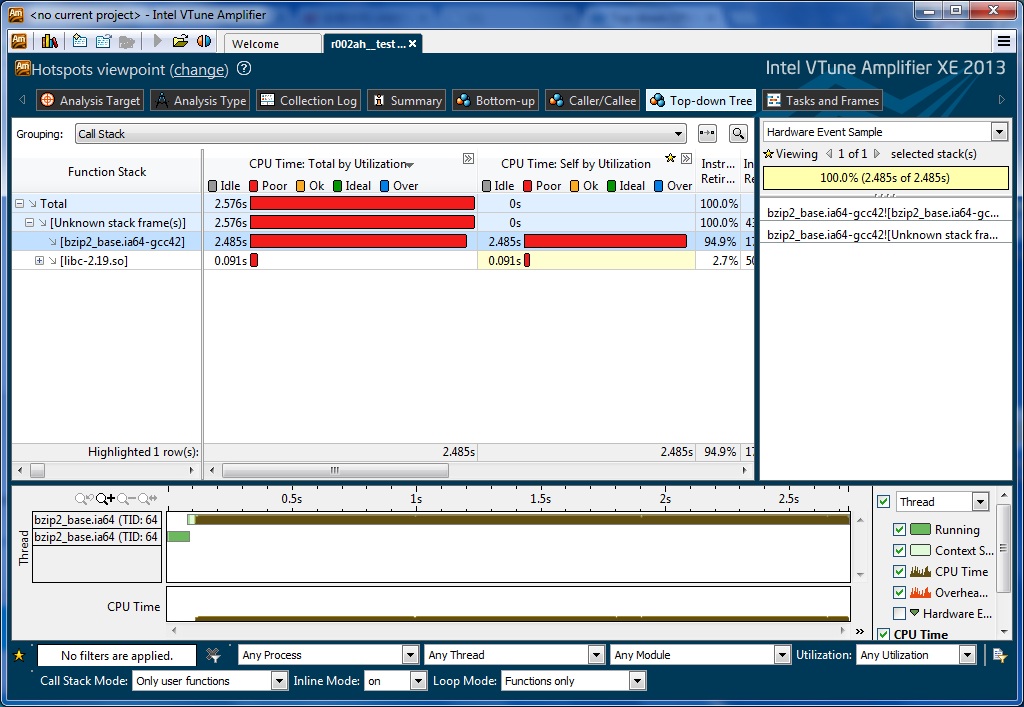
When I inspect the result using the Top-Down view I see that a loop takes X seconds to execute, but when I double-click its line and inspect the source code I see that the sum of CPU time for the loop's line is Y, where Y is ~2X, and in fact, Y is even greater than the CPU time of the whole program... Any clue why is that? This happens not only which this program... I have attached some screen shots.
Also, how does the "Inline Mode" on bottom right of the top-down view affects the CPU time results of the source view? Furthermore.. how is the CPU Time calculated for each of these modes: Loops Only / Functions Only and / Loops and Functions is selected?
Thanks in advance!
Link Copied
- Mark as New
- Bookmark
- Subscribe
- Mute
- Subscribe to RSS Feed
- Permalink
- Report Inappropriate Content
It seemed so strange that double CPU time spent in source view of [Loop at line 462 in compressStream], but only half CPU time of [Loop at line 462 in compressStream] in top-down report. One possible reason was that [Loop at line 462 in compressStream] was called by multiple callers, however I only saw one caller named "compressStream" in top-down report.
Could it be repeat if you change Loop-mode to "Functions only"? I mean that CPU time of source line in compressStream is consistent of result from top-down report?
I'm not sure if this is bug "loop-mode" relevant? It will better if you can attach result directory for investigating - I appreciate.
Thanks, Peter
- Mark as New
- Bookmark
- Subscribe
- Mute
- Subscribe to RSS Feed
- Permalink
- Report Inappropriate Content
Hello Peter.
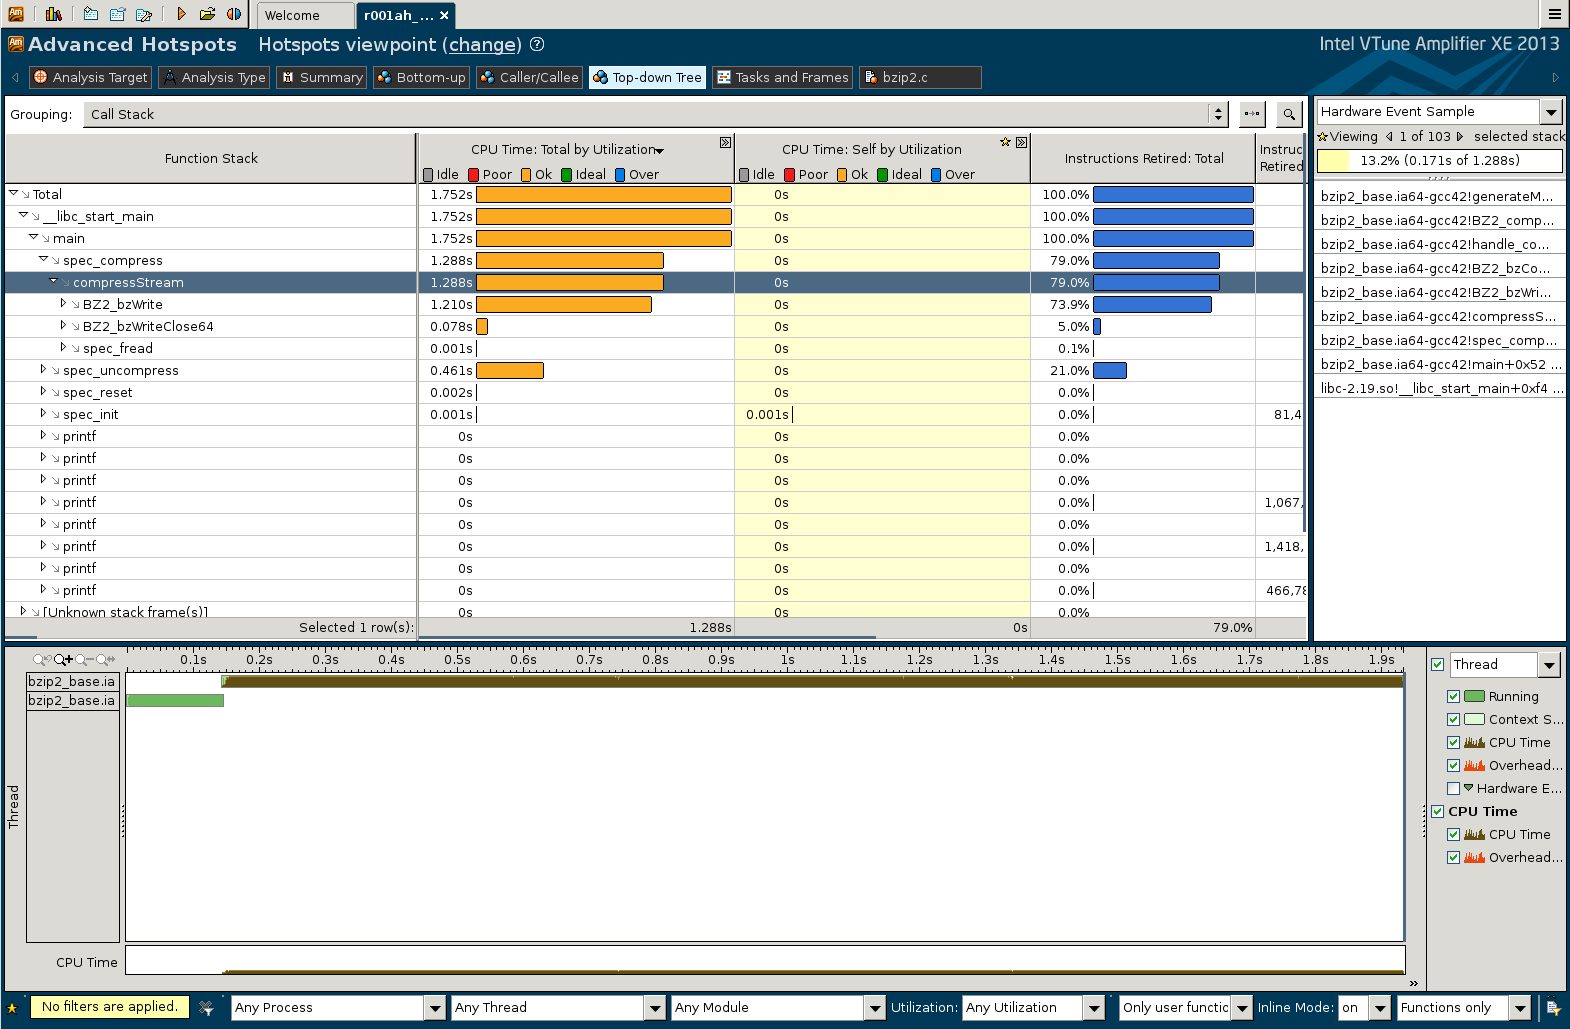
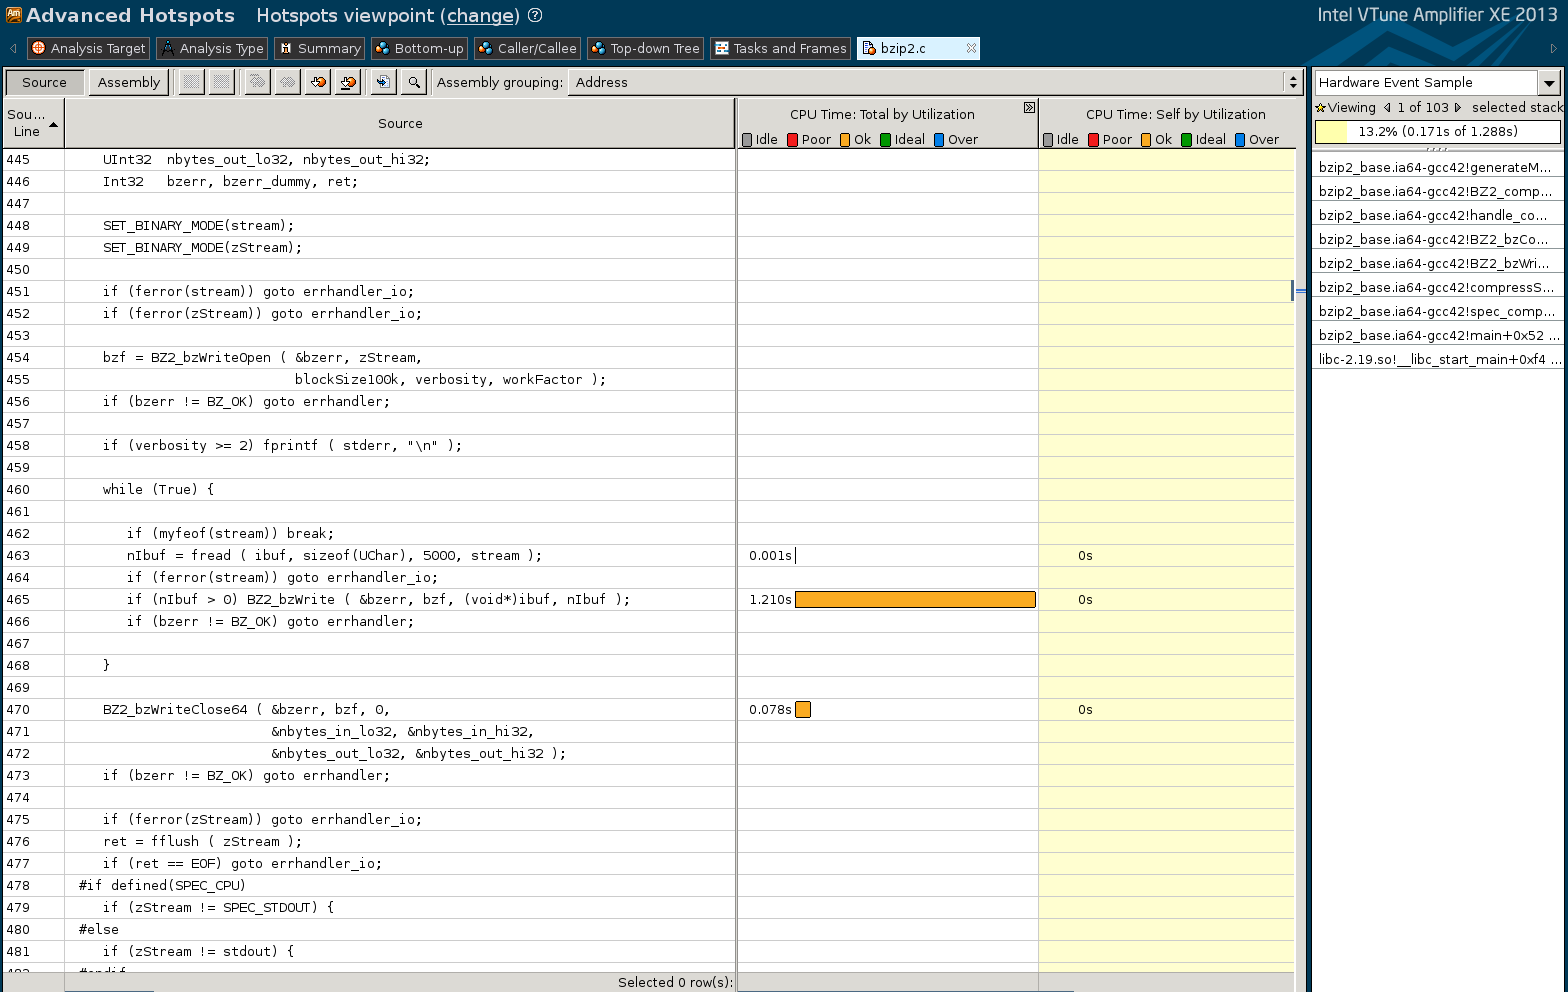
When I change "Loops and Functions" to "Functions Only" the result in TD and Source view is consistent.
I'm attaching print screens with Top-down report for Functions Only and also the result folder itself.
Another strange results are appearing with other functions, for instance, in Top Down view (with fun + loops) :
-> main
-> loop 295
loop 104
-> compressStream
loop 462
-> BZ2_bzWrite
loop 469
-> handle_compress
loop 426 [?]
loop 426 [?]
loop 426 [?]
The function "handle_compress" has three nested loops starting in the same line, the source code does not have this characteristic. Furthermore, when I double click in "handle_compress" and analyze its source the CPU Time of the loop starting at line 426 is repeated three times on lines inside its body..
I am attaching also the source code of the project, since its open source.
Thank you for helping with this,
- Mark as New
- Bookmark
- Subscribe
- Mute
- Subscribe to RSS Feed
- Permalink
- Report Inappropriate Content
Thank you. But after downloading r002ah.tar.gz - I cannot unzip it by using tar. Would you please check it on your side?
- Mark as New
- Bookmark
- Subscribe
- Mute
- Subscribe to RSS Feed
- Permalink
- Report Inappropriate Content
I had no problem opening it here. I'm sending now a "zip" version. Thank you.
Drop box link: https://db.tt/pl4lzhyU
- Mark as New
- Bookmark
- Subscribe
- Mute
- Subscribe to RSS Feed
- Permalink
- Report Inappropriate Content

- Mark as New
- Bookmark
- Subscribe
- Mute
- Subscribe to RSS Feed
- Permalink
- Report Inappropriate Content
Hello Divino C.
This is a known bug in VTune when we double counting per source line for mixed finction/loop loop mode (only functions or only loops should be OK). Will let you know when fix is available.
Thanks & Regards, Dmitry
- Mark as New
- Bookmark
- Subscribe
- Mute
- Subscribe to RSS Feed
- Permalink
- Report Inappropriate Content
Hi Peter.
The zip file content is OK. However, it seems that just copying the directory isn't sufficient to open the result in another computer... If you know another way to do this I'll be glad to give it a try.
Hello Dmitry-prohorov. Sad to hear that. I guess it would be useful if there were some place where we can see a list of these open bugs, is that possible?
Thanks!
- Mark as New
- Bookmark
- Subscribe
- Mute
- Subscribe to RSS Feed
- Permalink
- Report Inappropriate Content
Just right-click on result directory and zip it, extracting result in other machine should reproduce the problem.
I have sent you private email address, please send me zipped file (result directory) - it can reproduce the problem posted by you at 05/22/2014 - 02:46
Thanks, Peter
- Mark as New
- Bookmark
- Subscribe
- Mute
- Subscribe to RSS Feed
- Permalink
- Report Inappropriate Content
Hello Peter.
This is exactly what I've done. I sent the zipped file from the result dir to your email also.
- Mark as New
- Bookmark
- Subscribe
- Mute
- Subscribe to RSS Feed
- Permalink
- Report Inappropriate Content
OK. Thanks for your data...
I have reported this problem with your data to our engineering, and will update if any progress.
Two concerns in this thread:
1. Function / Loop mixed mode: performance data in source view is inconsistent of top-down's
2. Nested loop seems not recursive, but repeat three times.
Regards, Peter
- Subscribe to RSS Feed
- Mark Topic as New
- Mark Topic as Read
- Float this Topic for Current User
- Bookmark
- Subscribe
- Printer Friendly Page