- Mark as New
- Bookmark
- Subscribe
- Mute
- Subscribe to RSS Feed
- Permalink
- Report Inappropriate Content
Hello All,
Can someone explain me what is the use of "vectspots" reports and how to interpret it? Is this related to vectorisation intensity? I don't see documentation in the user manual.
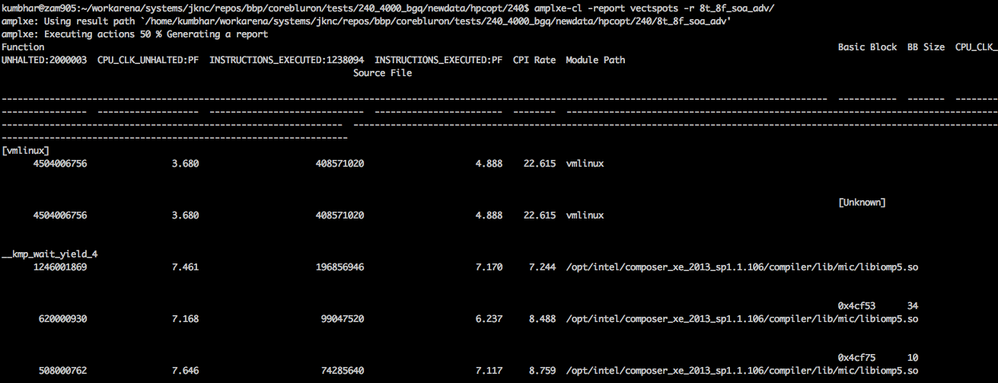
When I run command line report using amplxe-cl -report vectspots I see:
Function                                                                                                                                                                       Basic Block  BB Size  CPU_CLK_UNHALTED:2000003  CPU_CLK_UNHALTED:PF  Module Path                                                                                                                                  Source File
-----------------------------------------------------------------------------------------------------------------------------------------------------------------------------  -----------  -------  ------------------------  -------------------  -------------------------------------------------------------------------------------------------------------------------------------------  ----------------------------------------------------------------------------------------------------------------------------------------------------------------------------------------
   0x4f1a80     103                   14512021768                7.272  exe.mic_linux exe.c

               0x4f0843     414                   10908016362                7.091  exe.mic_linux  exe.c
Link Copied
- Mark as New
- Bookmark
- Subscribe
- Mute
- Subscribe to RSS Feed
- Permalink
- Report Inappropriate Content
Hi Pramod:
I'm sorry, but I can't really tell what you are talking about. Maybe you can post a screen capture? I mean, what is the context? I assume you tried to post a command line report of some kind, but I don't see anything like "vectspots". :(
- Mark as New
- Bookmark
- Subscribe
- Mute
- Subscribe to RSS Feed
- Permalink
- Report Inappropriate Content
Ok, in the latest Vtune (vtune_amplifier_xe_2015.1.1.380310) I see new report available with name "vectspots":
$ amplxe-cl --help report
Available Reports:
    ...........
    top-down                 Display a call tree for your target application and provide CPU and wait time for each function.
    vectspots
I don't see any documentation for this report type. I attached the screenshot of the report.
- Mark as New
- Bookmark
- Subscribe
- Mute
- Subscribe to RSS Feed
- Permalink
- Report Inappropriate Content
Hi Pramod:
Occasionally, we experiment with new capabilities that may or may not appear in the product and accidentally exposed a new metric/report/etc. Please ignore this report for now and we’ll provide additional information if and when the capability is fully tested and released.
- Subscribe to RSS Feed
- Mark Topic as New
- Mark Topic as Read
- Float this Topic for Current User
- Bookmark
- Subscribe
- Printer Friendly Page
