- Mark as New
- Bookmark
- Subscribe
- Mute
- Subscribe to RSS Feed
- Permalink
- Report Inappropriate Content
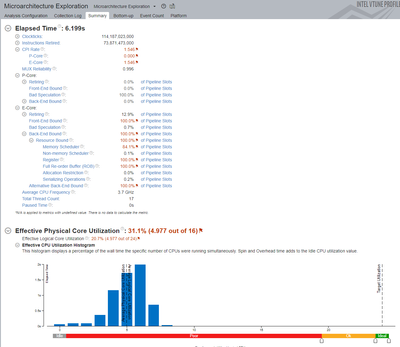
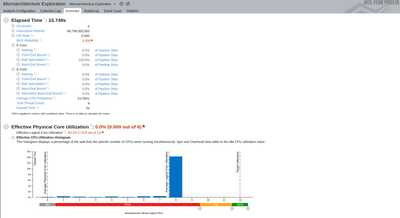
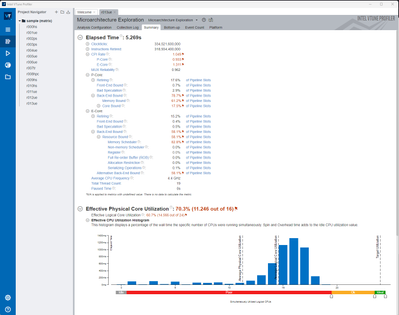
For some reason the P-Core data is not showing on my 12900k on the matrix example.
I'm using V-Tune straight "out of the box" just running the example program as shown. However, in Threading it does show that all 16 (physical) cores are being being targeted as well as saying that on the console when using the example.
I have used V-Tune on my laptop which is also alderlake and cannot replicate the error.
Could there be a security feature stopping the drivers from being able to see the cpu event counters soemwhere?
Link Copied
- Mark as New
- Bookmark
- Subscribe
- Mute
- Subscribe to RSS Feed
- Permalink
- Report Inappropriate Content
Hi,
Thank you for posting in the Intel Communities.
We are sorry to say that we are unable to reproduce your issue from our end on the Alder Lake machine. For further investigation, we need the below details.
Could you please answer the following questions:
1. Are you trying to run your application inside of a VM?
2. Please share the operating system details (Windows 10, Ubuntu 18.04, Centos8, etc.) and processor details.
3. Try with a different sample and let us know if you're facing a similar issue. (Important step)
Self-checker: (windows)
1. Run command prompt as administrator
2. To set the environment variables run the below command:
<Vtune_installation_directory\2022.2.0\vtune-vars.bat>example: C:\Program Files (x86)\Intel\oneAPI\vtune\2022.2.0\vtune-vars.bat
3. To run vtune-self-checker run the below command:
<Vtune_installation_directory\2022.2.0\bin64\vtune-self-checker.bat>example: C:\Program Files (x86)\Intel\oneAPI\vtune\2022.3.0\bin64\vtune-self-checker.bat
Self-checker:(linux)
1. Run commands in the terminal as superuser/root user.
2. Set the environment variables.
source /opt/intel/oneapi/setvars.sh3. Run vtune-self-checker run the below command:
sh /opt/intel/oneapi/vtune/latest/bin64/vtune-self-checker.sh
Please attach screenshots and self-checker logs.
Thanks,
Jaideep
- Mark as New
- Bookmark
- Subscribe
- Mute
- Subscribe to RSS Feed
- Permalink
- Report Inappropriate Content
Hi Jaideep,
I can confirm that my machine is not runnign in a virtual machine.
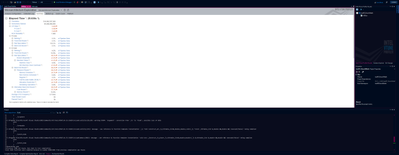
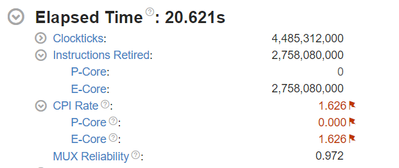
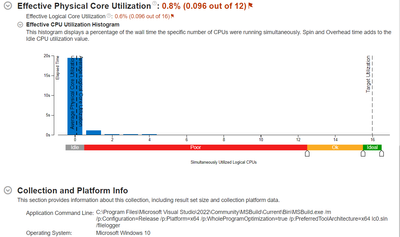
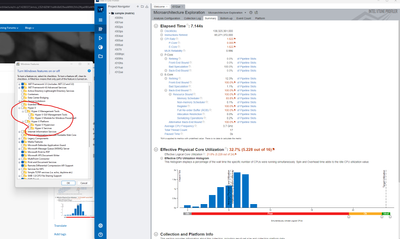
I have tried from another application I've designed and i still face the same issues. Below I have added a screenshot fromk within VS2022 and as you can see it's the same.
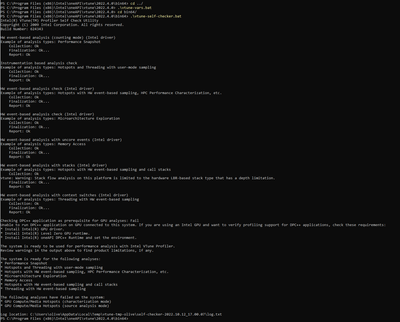
I have ran the self checker and it all seems to be okay, I have attached a screenshot below of the results.
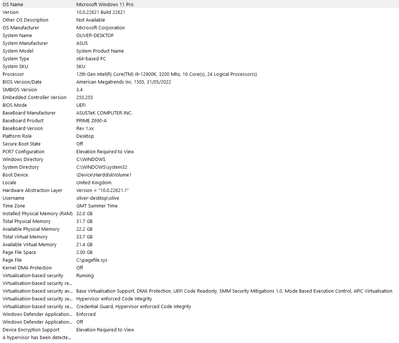
As a note, I did have this issue many months ago but after reinstalling Windows it went away and reported fine on both P and E cores. Now however it has come back, and after reattempting to reinstall windows the issue has persisted. None of my other Alderlake machines experiance the same issues as this however. Here is a screenshot of my system info also:
Oliver
- Mark as New
- Bookmark
- Subscribe
- Mute
- Subscribe to RSS Feed
- Permalink
- Report Inappropriate Content
I have exactly the same issue! And looks like this post is also the same issue
My system:
CPU: i5 12400
OS: RHEL8
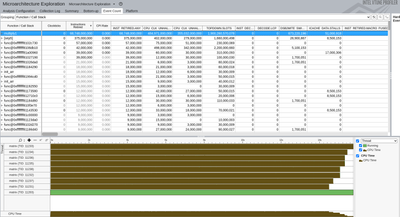
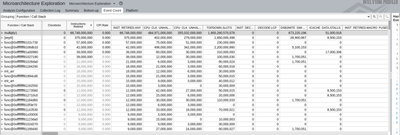
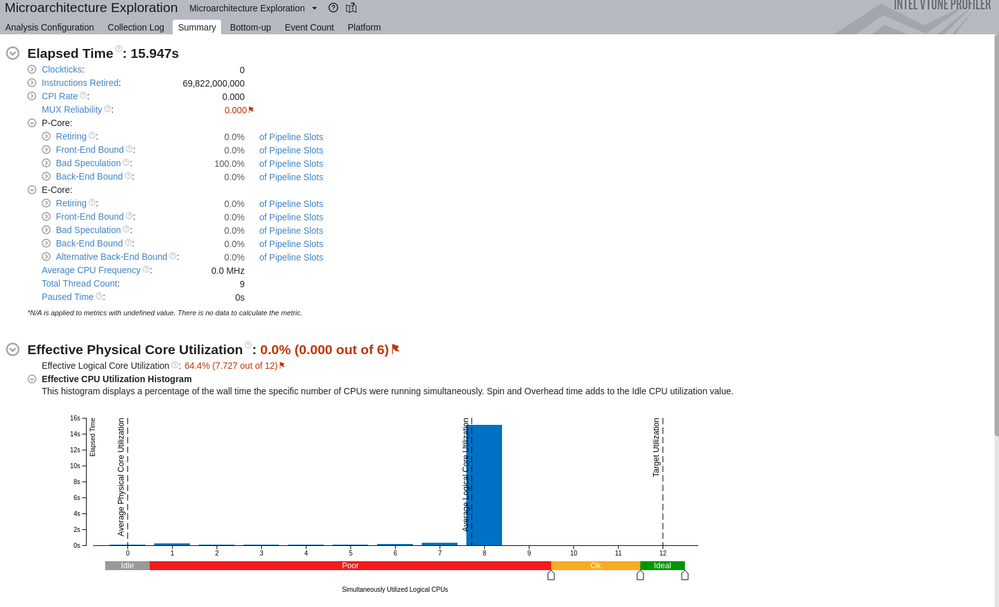
When looking at "Event Count" tab, it seems that most counters are present/correctly incremented, but some counters like "Clockticks" are stuck at 0. I'm including an image of the Event Count tab, and also I'm including a CSV file with Event counts.
When running the demo matrix example from command line:
[kevin@localhost bin64]$ ./vtune -collect uarch-exploration -r '/home/kevin/Documents/vtune_test'  /home/kevin/intel/vtune/samples/matrix/matrix
vtune: Warning: To enable hardware event-based sampling, VTune Profiler has disabled the NMI watchdog timer. The watchdog timer will be re-enabled after collection completes.
vtune: Collection started. To stop the collection, either press CTRL-C or enter from another console window: vtune -r /home/kevin/Documents/vtune_test -command stop.
Addr of buf1 = 0x7fe3f4f61010
Offs of buf1 = 0x7fe3f4f61180
Addr of buf2 = 0x7fe3f2f60010
Offs of buf2 = 0x7fe3f2f601c0
Addr of buf3 = 0x7fe3f0f5f010
Offs of buf3 = 0x7fe3f0f5f100
Addr of buf4 = 0x7fe3eef5e010
Offs of buf4 = 0x7fe3eef5e140
Threads #: 8 Pthreads
Matrix size: 2048
Using multiply kernel: multiply1
Execution time = 15.122 seconds
vtune: Collection stopped.
vtune: Using result path `/home/kevin/Documents/vtune_test'
vtune: Executing actions 19 % Resolving information for `ld-2.28.so'
vtune: Warning: Cannot locate file `nft_counter.ko'.
vtune: Executing actions 19 % Resolving information for `nft_counter'
vtune: Warning: Cannot locate file `bridge.ko'.
vtune: Executing actions 19 % Resolving information for `matrix'
vtune: Warning: Cannot locate file `r8169.ko'.
vtune: Executing actions 19 % Resolving information for `r8169'
vtune: Warning: Cannot locate file `nf_tables.ko'.
vtune: Executing actions 19 % Resolving information for `nf_tables'
vtune: Warning: Cannot locate file `nf_conntrack.ko'.
vtune: Executing actions 21 % Resolving information for `libc-2.28.so'
vtune: Warning: Cannot locate file `nft_ct.ko'.
vtune: Executing actions 21 % Resolving information for `nft_ct'
vtune: Warning: Cannot locate debugging information for file `/usr/lib64/libc-2.28.so'.
vtune: Warning: Cannot locate file `drm.ko'.
vtune: Executing actions 21 % Resolving information for `drm'
vtune: Warning: Cannot locate file `kvm.ko'.
vtune: Executing actions 22 % Resolving information for `kvm'
vtune: Warning: Cannot locate file `xfs.ko'.
vtune: Executing actions 22 % Resolving information for `xfs'
vtune: Warning: Cannot locate file `i915.ko'.
vtune: Executing actions 22 % Resolving information for `i915'
vtune: Warning: Cannot locate file `sep5.ko'.
vtune: Executing actions 22 % Resolving information for `vmlinux'
vtune: Warning: Function and source-level analysis for the Linux kernel will not be possible since neither debug version of the kernel nor kernel symbol tables are found. See the Enabling Linux Kernel Analysis topic in the product online help for instructions.
vtune: Executing actions 75 % Generating a report                              Elapsed Time: 15.135s
    Clockticks: 0
        P-Core: 0
        E-Core: 0
    Instructions Retired: 69,798,000,000
        P-Core: 0
        E-Core: 0
    CPI Rate: 0.000
        P-Core: 0.000
        E-Core: 0.000
    MUX Reliability: 0.000
     | Precision of collected HW event data is not enough. Metrics data may be
     | unreliable. Consider increasing your application execution time, using
     | the multiple runs mode instead of event multiplexing, or creating a
     | custom analysis with a limited subset of HW events. If you are using a
     | driverless collection, consider reducing the value of
     | /sys/bus/event_source/devices/cpu/perf_event_mux_interval_ms file.
     |
    P-Core
        Retiring: 0.0% of Pipeline Slots
            Light Operations: 0.0% of Pipeline Slots
                FP Arithmetic: 0.0% of uOps
                    FP x87: 0.0% of uOps
                    FP Scalar: 0.0% of uOps
                    FP Vector: 0.0% of uOps
                Memory Operations: 0.0% of Pipeline Slots
                Fused Instructions: 0.0% of Pipeline Slots
                Non Fused Branches: 0.0% of Pipeline Slots
                Nop Instructions: 0.0% of Pipeline Slots
                Other: 0.0% of Pipeline Slots
            Heavy Operations: 0.0% of Pipeline Slots
                Microcode Sequencer: 0.0% of Pipeline Slots
                    Assists: 0.0% of Pipeline Slots
                    CISC: 0.0% of Pipeline Slots
        Front-End Bound: 0.0% of Pipeline Slots
            Front-End Latency: 0.0% of Pipeline Slots
                ICache Misses: 0.0% of Clockticks
                ITLB Overhead: 0.0% of Clockticks
                Branch Resteers: 0.0% of Clockticks
                    Mispredicts Resteers: 0.0% of Clockticks
                    Clears Resteers: 0.0% of Clockticks
                    Unknown Branches: 0.0% of Clockticks
                DSB Switches: 0.0% of Clockticks
                Length Changing Prefixes: 0.0% of Clockticks
                MS Switches: 0.0% of Clockticks
            Front-End Bandwidth: 0.0% of Pipeline Slots
                Front-End Bandwidth MITE: 0.0% of Pipeline Slots
                    Decoder-0 Alone: 0.0% of Clockticks
                Front-End Bandwidth DSB: 0.0% of Pipeline Slots
                Front-End Bandwidth LSD: 0.0% of Pipeline Slots
                (Info) DSB Coverage: 0.0%
                (Info) LSD Coverage: 0.0%
                (Info) DSB Misses Cost: 0.0% of Pipeline Slots
        Bad Speculation: 100.0% of Pipeline Slots
         | A significant proportion of pipeline slots containing useful work are
         | being cancelled. This can be caused by mispredicting branches or by
         | machine clears. Note that this metric value may be highlighted due to
         | Branch Resteers issue.
         |
            Branch Mispredict: 0.0% of Pipeline Slots
            Machine Clears: 100.0% of Pipeline Slots
             | Issue: A significant portion of execution time is spent handling
             | machine clears.
             |
             | Tips: See the "Memory Disambiguation" section in the Intel 64 and
             | IA-32 Architectures Optimization Reference Manual.
             |
        Back-End Bound: 0.0% of Pipeline Slots
            Memory Bound: 0.0% of Pipeline Slots
                L1 Bound: 0.0% of Clockticks
                    DTLB Overhead: 0.0% of Clockticks
                        Load STLB Hit: 0.0% of Clockticks
                        Load STLB Miss: 0.0% of Clockticks
                    Loads Blocked by Store Forwarding: 0.0% of Clockticks
                    Lock Latency: 0.0% of Clockticks
                    Split Loads: 0.0% of Clockticks
                    FB Full: 0.0% of Clockticks
                L2 Bound: 0.0% of Clockticks
                L3 Bound: 0.0% of Clockticks
                    Contested Accesses: 0.0% of Clockticks
                    Data Sharing: 0.0% of Clockticks
                    L3 Latency: 0.0% of Clockticks
                    SQ Full: 0.0% of Clockticks
                DRAM Bound: 0.0% of Clockticks
                    Memory Bandwidth: 0.0% of Clockticks
                    Memory Latency: 0.0% of Clockticks
                Store Bound: 0.0% of Clockticks
                    Store Latency: 0.0% of Clockticks
                    False Sharing: 0.0% of Clockticks
                    Split Stores: 0.0% of Clockticks
                    Streaming Stores: 0.0% of Clockticks
                    DTLB Store Overhead: 0.0% of Clockticks
                        Store STLB Hit: 0.0% of Clockticks
                        Store STLB Hit: 0.0% of Clockticks
            Core Bound: 0.0% of Pipeline Slots
                Divider: 0.0% of Clockticks
                Port Utilization: 0.0% of Clockticks
                    Cycles of 0 Ports Utilized: 0.0% of Clockticks
                        Serializing Operations: 0.0% of Clockticks
                            Slow Pause: 0.0% of Clockticks
                            Memory Fence: 0.0% of Clockticks
                        Mixing Vectors: 0.0% of Clockticks
                    Cycles of 1 Port Utilized: 0.0% of Clockticks
                    Cycles of 2 Ports Utilized: 0.0% of Clockticks
                    Cycles of 3+ Ports Utilized: 0.0% of Clockticks
                        ALU Operation Utilization: 0.0% of Clockticks
                            Port 0: 0.0% of Clockticks
                            Port 1: 0.0% of Clockticks
                            Port 6: 0.0% of Clockticks
                        Load Operation Utilization: 0.0% of Clockticks
                        Store Operation Utilization: 0.0% of Clockticks
    E-Core
        Retiring: 0.0% of Pipeline Slots
            General Retirement: 0.0% of Pipeline Slots
                FP Arithmetic: 0.0% of Pipeline Slots
                Other: 0.0% of Pipeline Slots
            Microcode Sequencer: 0.0% of Pipeline Slots
        Front-End Bound: 0.0% of Pipeline Slots
            Front-End Latency: 0.0% of Pipeline Slots
                ICache Misses: 0.0% of Pipeline Slots
                ITLB Overhead: 0.0% of Pipeline Slots
                BACLEARS: 0.0% of Pipeline Slots
                Branch Resteers: 0.0% of Pipeline Slots
            Front-End Bandwidth: 0.0% of Pipeline Slots
                Cisc: 0.0% of Pipeline Slots
                Decode: 0.0% of Pipeline Slots
                Pre-Decode Wrong: 0.0% of Pipeline Slots
                Front-End Other: 0.0% of Pipeline Slots
        Bad Speculation: 0.0% of Pipeline Slots
            Branch Mispredict: 0.0% of Pipeline Slots
            Machine Clears: 0.0% of Pipeline Slots
                Machine Clear: 0.0% of Pipeline Slots
                MO Machine Clear Overhead: 0.0% of Pipeline Slots
        Back-End Bound: 0.0% of Pipeline Slots
            Resource Bound: 0.0% of Pipeline Slots
                Memory Scheduler: 0.0% of Pipeline Slots
                Non-memory Scheduler: 0.0% of Pipeline Slots
                Register: 0.0% of Pipeline Slots
                Full Re-order Buffer (ROB): 0.0% of Pipeline Slots
                Allocation Restriction: 0.0% of Pipeline Slots
                Serializing Operations: 0.0% of Pipeline Slots
        Alternative Back-End Bound: 0.0% of Pipeline Slots
            Core Bound: 0.0%
            Memory Bound: 0.0%
                L2 Bound: 0.0%
                L3 Bound: 0.0%
                DRAM Bound: 0.0%
    Average CPU Frequency: 0.000 MHz
    Total Thread Count: 9
    Paused Time: 0s
Effective Physical Core Utilization: 0.0% (0.000 out of 6)
 | The metric value is low, which may signal a poor physical CPU cores
 | utilization caused by:
 |     - load imbalance
 |     - threading runtime overhead
 |     - contended synchronization
 |     - thread/process underutilization
 |     - incorrect affinity that utilizes logical cores instead of physical
 |       cores
 | Explore sub-metrics to estimate the efficiency of MPI and OpenMP parallelism
 | or run the Locks and Waits analysis to identify parallel bottlenecks for
 | other parallel runtimes.
 |
    Effective Logical Core Utilization: 63.8% (7.653 out of 12)
     | The metric value is low, which may signal a poor logical CPU cores
     | utilization. Consider improving physical core utilization as the first
     | step and then look at opportunities to utilize logical cores, which in
     | some cases can improve processor throughput and overall performance of
     | multi-threaded applications.
     |
Collection and Platform Info
    Application Command Line: /home/kevin/intel/vtune/samples/matrix/matrix
    User Name: kevin
    Operating System: 4.18.0-372.19.1.el8_6.x86_64 Red Hat Enterprise Linux release 8.6 (Ootpa)
    Computer Name: localhost.localdomain
    Result Size: 305.1 MB
    Collection start time: 12:13:29 15/10/2022 UTC
    Collection stop time: 12:13:44 15/10/2022 UTC
    Collector Type: Event-based sampling driver
    CPU
        Name: Intel(R) microarchitecture code named Alderlake-S
        Frequency: 2.995 GHz
        Logical CPU Count: 12
        Cache Allocation Technology
            Level 2 capability: available
            Level 3 capability: not detected

If you want to skip descriptions of detected performance issues in the report,
enter: vtune -report summary -report-knob show-issues=false -r <my_result_dir>.
Alternatively, you may view the report in the csv format: vtune -report
<report_name> -format=csv.
vtune: Executing actions 100 % done
And this is the output of self_checker:
[kevin@localhost bin64]$ sudo ./vtune-self-checker.sh
[sudo] password for kevin:
Intel(R) VTune(TM) Profiler Self Check Utility
Copyright (C) 2009 Intel Corporation. All rights reserved.
Build Number: 624050

HW event-based analysis (counting mode) (Intel driver)
Example of analysis types: Performance Snapshot
    Collection: Ok
vtune: Warning: Cannot collect GPU hardware metrics because libmd.so was not found. Make sure you have installed Metrics Discovery API library from https://github.com/intel/metrics-discovery. See Error Message: Cannot Collect GPU Hardware Metrics help topic for more details.
    Finalization: Ok...
vtune: Warning: Cannot collect GPU hardware metrics because libmd.so was not found. Make sure you have installed Metrics Discovery API library from https://github.com/intel/metrics-discovery. See Error Message: Cannot Collect GPU Hardware Metrics help topic for more details.

    Report: Ok

Instrumentation based analysis check
Example of analysis types: Hotspots and Threading with user-mode sampling
    Collection: Ok
    Finalization: Ok...
    Report: Ok

HW event-based analysis check (Intel driver)
Example of analysis types: Hotspots with HW event-based sampling, HPC Performance Characterization, etc.
    Collection: Ok
vtune: Warning: To enable hardware event-based sampling, VTune Profiler has disabled the NMI watchdog timer. The watchdog timer will be re-enabled after collection completes.
    Finalization: Ok...
vtune: Warning: Cannot locate debugging information for the Linux kernel. Source-level analysis will not be possible. Function-level analysis will be limited to kernel symbol tables. See the Enabling Linux Kernel Analysis topic in the product online help for instructions.

    Report: Ok

HW event-based analysis check (Intel driver)
Example of analysis types: Microarchitecture Exploration
    Collection: Ok
vtune: Warning: To enable hardware event-based sampling, VTune Profiler has disabled the NMI watchdog timer. The watchdog timer will be re-enabled after collection completes.
    Finalization: Ok...
vtune: Warning: Cannot locate debugging information for the Linux kernel. Source-level analysis will not be possible. Function-level analysis will be limited to kernel symbol tables. See the Enabling Linux Kernel Analysis topic in the product online help for instructions.

    Report: Ok

HW event-based analysis with uncore events (Intel driver)
Example of analysis types: Memory Access
    Collection: Ok
vtune: Warning: To enable hardware event-based sampling, VTune Profiler has disabled the NMI watchdog timer. The watchdog timer will be re-enabled after collection completes.
    Finalization: Ok...
vtune: Warning: Cannot locate debugging information for the Linux kernel. Source-level analysis will not be possible. Function-level analysis will be limited to kernel symbol tables. See the Enabling Linux Kernel Analysis topic in the product online help for instructions.

    Report: Ok

HW event-based analysis with stacks (Intel driver)
Example of analysis types: Hotspots with HW event-based sampling and call stacks
    Collection: Ok
vtune: Warning: To enable hardware event-based sampling, VTune Profiler has disabled the NMI watchdog timer. The watchdog timer will be re-enabled after collection completes.
    Finalization: Ok...
vtune: Warning: Cannot locate debugging information for the Linux kernel. Source-level analysis will not be possible. Function-level analysis will be limited to kernel symbol tables. See the Enabling Linux Kernel Analysis topic in the product online help for instructions.

    Report: Ok

HW event-based analysis with context switches (Intel driver)
Example of analysis types: Threading with HW event-based sampling
    Collection: Ok
vtune: Warning: To enable hardware event-based sampling, VTune Profiler has disabled the NMI watchdog timer. The watchdog timer will be re-enabled after collection completes.
    Finalization: Ok...
vtune: Warning: Cannot locate debugging information for the Linux kernel. Source-level analysis will not be possible. Function-level analysis will be limited to kernel symbol tables. See the Enabling Linux Kernel Analysis topic in the product online help for instructions.

    Report: Ok

Checking DPC++ application as prerequisite for GPU analyses: Fail
Unable to run DPC++ application on GPU connected to this system. If you are using an Intel GPU and want to verify profiling support for DPC++ applications, check these requirements:
* Install Intel(R) GPU driver.
* Install Intel(R) Level Zero GPU runtime.
* Install Intel(R) oneAPI DPC++ Runtime and set the environment.

The system is ready to be used for performance analysis with Intel VTune Profiler.
Review warnings in the output above to find product limitations, if any.

The system is ready for the following analyses:
* Performance Snapshot
* Hotspots and Threading with user-mode sampling
* Hotspots with HW event-based sampling, HPC Performance Characterization, etc.
* Microarchitecture Exploration
* Memory Access
* Hotspots with HW event-based sampling and call stacks
* Threading with HW event-based sampling

The following analyses have failed on the system:
* GPU Compute/Media Hotspots (characterization mode)
* GPU Compute/Media Hotspots (source analysis mode)

Log location: /tmp/vtune-tmp-root/self-checker-2022.10.15_14.27.41/log.txt
- Mark as New
- Bookmark
- Subscribe
- Mute
- Subscribe to RSS Feed
- Permalink
- Report Inappropriate Content
Hi Jaideep,
I'm seeing the same issue. Please find answers to the questions you ask below.
Any help or next steps are appreciated.
Thanks,
Max
I'm not running in a VM.
I have tried three different applications and see the same behavior in each. Task manager/Resource Monitors shows all 16 cores being utilized. Vtune suggests only the E-cores are active.
One other tidbit - In the Collection and Platform info - the report claims I'm running Windows 10, but as you can see from the copy and paste from windows device info, I'm running Windows 11.
Device name xxx
Processor 12th Gen Intel(R) Core(TM) i7-1270P 2.20 GHz
Installed RAM 16.0 GB (15.6 GB usable)
System type 64-bit operating system, x64-based processor
Pen and touch No pen or touch input is available for this display
Edition Windows 11 Pro
Version 21H2
Installed on 10/6/2022
OS build 22000.1098
Experience Windows Feature Experience Pack 1000.22000.1098.0
C:\Windows\System32>"C:\Program Files (x86)\Intel\oneAPI\vtune\2022.4.0\bin64\vtune-self-checker.bat"
Intel(R) VTune(TM) Profiler Self Check Utility
Copyright (C) 2009 Intel Corporation. All rights reserved.
Build Number: 624343
HW event-based analysis (counting mode) (Intel driver)
Example of analysis types: Performance Snapshot
Collection: Ok
Finalization: Ok...
Report: Ok
Instrumentation based analysis check
Example of analysis types: Hotspots and Threading with user-mode sampling
Collection: Ok
Finalization: Ok...
Report: Ok
HW event-based analysis check (Intel driver)
Example of analysis types: Hotspots with HW event-based sampling, HPC Performance Characterization, etc.
Collection: Ok
Finalization: Ok...
Report: Ok
HW event-based analysis check (Intel driver)
Example of analysis types: Microarchitecture Exploration
Collection: Ok
Finalization: Ok...
Report: Ok
HW event-based analysis with uncore events (Intel driver)
Example of analysis types: Memory Access
Collection: Ok
Finalization: Ok...
vtune: Warning: The result contains a lot of raw data. Finalization may take a long time to complete.
Report: Ok
HW event-based analysis with stacks (Intel driver)
Example of analysis types: Hotspots with HW event-based sampling and call stacks
Collection: Ok
Finalization: Ok...
Report: Ok
HW event-based analysis with context switches (Intel driver)
Example of analysis types: Threading with HW event-based sampling
Collection: Ok
Finalization: Ok...
Report: Ok
Checking DPC++ application as prerequisite for GPU analyses: Fail
Unable to run DPC++ application on GPU connected to this system. If you are using an Intel GPU and want to verify profiling support for DPC++ applications, check these requirements:
* Install Intel(R) GPU driver.
* Install Intel(R) Level Zero GPU runtime.
* Install Intel(R) oneAPI DPC++ Runtime and set the environment.
The system is ready to be used for performance analysis with Intel VTune Profiler.
Review warnings in the output above to find product limitations, if any.
The system is ready for the following analyses:
* Performance Snapshot
* Hotspots and Threading with user-mode sampling
* Hotspots with HW event-based sampling, HPC Performance Characterization, etc.
* Microarchitecture Exploration
* Memory Access
* Hotspots with HW event-based sampling and call stacks
* Threading with HW event-based sampling
The following analyses have failed on the system:
* GPU Compute/Media Hotspots (characterization mode)
* GPU Compute/Media Hotspots (source analysis mode)
Log location: C:\Users\optane\AppData\Local\Temp\vtune-tmp-optane\self-checker-2022.10.17_09.15.15\log.txt
C:\Program Files (x86)\Intel\oneAPI\vtune\2022.4.0\bin64>
- Mark as New
- Bookmark
- Subscribe
- Mute
- Subscribe to RSS Feed
- Permalink
- Report Inappropriate Content
Not sure why my comment got deleted, but I've got exactly the same issue on i5 12400 and RHEL8.
Although when I look at Event Count tab, I can see that most counters look like they are working correctly, but for example "Clockticks" column is always zero:
I'm including a CSV file with exported counter values as attachment.
This is the output of self checker:
[kevin@localhost bin64]$ sudo ./vtune-self-checker.sh
[sudo] password for kevin:
Intel(R) VTune(TM) Profiler Self Check Utility
Copyright (C) 2009 Intel Corporation. All rights reserved.
Build Number: 624050

HW event-based analysis (counting mode) (Intel driver)
Example of analysis types: Performance Snapshot
    Collection: Ok
vtune: Warning: Cannot collect GPU hardware metrics because libmd.so was not found. Make sure you have installed Metrics Discovery API library from https://github.com/intel/metrics-discovery. See Error Message: Cannot Collect GPU Hardware Metrics help topic for more details.
    Finalization: Ok...
vtune: Warning: Cannot collect GPU hardware metrics because libmd.so was not found. Make sure you have installed Metrics Discovery API library from https://github.com/intel/metrics-discovery. See Error Message: Cannot Collect GPU Hardware Metrics help topic for more details.

    Report: Ok

Instrumentation based analysis check
Example of analysis types: Hotspots and Threading with user-mode sampling
    Collection: Ok
    Finalization: Ok...
    Report: Ok

HW event-based analysis check (Intel driver)
Example of analysis types: Hotspots with HW event-based sampling, HPC Performance Characterization, etc.
    Collection: Ok
vtune: Warning: To enable hardware event-based sampling, VTune Profiler has disabled the NMI watchdog timer. The watchdog timer will be re-enabled after collection completes.
    Finalization: Ok...
vtune: Warning: Cannot locate debugging information for the Linux kernel. Source-level analysis will not be possible. Function-level analysis will be limited to kernel symbol tables. See the Enabling Linux Kernel Analysis topic in the product online help for instructions.

    Report: Ok

HW event-based analysis check (Intel driver)
Example of analysis types: Microarchitecture Exploration
    Collection: Ok
vtune: Warning: To enable hardware event-based sampling, VTune Profiler has disabled the NMI watchdog timer. The watchdog timer will be re-enabled after collection completes.
    Finalization: Ok...
vtune: Warning: Cannot locate debugging information for the Linux kernel. Source-level analysis will not be possible. Function-level analysis will be limited to kernel symbol tables. See the Enabling Linux Kernel Analysis topic in the product online help for instructions.

    Report: Ok

HW event-based analysis with uncore events (Intel driver)
Example of analysis types: Memory Access
    Collection: Ok
vtune: Warning: To enable hardware event-based sampling, VTune Profiler has disabled the NMI watchdog timer. The watchdog timer will be re-enabled after collection completes.
    Finalization: Ok...
vtune: Warning: Cannot locate debugging information for the Linux kernel. Source-level analysis will not be possible. Function-level analysis will be limited to kernel symbol tables. See the Enabling Linux Kernel Analysis topic in the product online help for instructions.

    Report: Ok

HW event-based analysis with stacks (Intel driver)
Example of analysis types: Hotspots with HW event-based sampling and call stacks
    Collection: Ok
vtune: Warning: To enable hardware event-based sampling, VTune Profiler has disabled the NMI watchdog timer. The watchdog timer will be re-enabled after collection completes.
    Finalization: Ok...
vtune: Warning: Cannot locate debugging information for the Linux kernel. Source-level analysis will not be possible. Function-level analysis will be limited to kernel symbol tables. See the Enabling Linux Kernel Analysis topic in the product online help for instructions.

    Report: Ok

HW event-based analysis with context switches (Intel driver)
Example of analysis types: Threading with HW event-based sampling
    Collection: Ok
vtune: Warning: To enable hardware event-based sampling, VTune Profiler has disabled the NMI watchdog timer. The watchdog timer will be re-enabled after collection completes.
    Finalization: Ok...
vtune: Warning: Cannot locate debugging information for the Linux kernel. Source-level analysis will not be possible. Function-level analysis will be limited to kernel symbol tables. See the Enabling Linux Kernel Analysis topic in the product online help for instructions.

    Report: Ok

Checking DPC++ application as prerequisite for GPU analyses: Fail
Unable to run DPC++ application on GPU connected to this system. If you are using an Intel GPU and want to verify profiling support for DPC++ applications, check these requirements:
* Install Intel(R) GPU driver.
* Install Intel(R) Level Zero GPU runtime.
* Install Intel(R) oneAPI DPC++ Runtime and set the environment.

The system is ready to be used for performance analysis with Intel VTune Profiler.
Review warnings in the output above to find product limitations, if any.

The system is ready for the following analyses:
* Performance Snapshot
* Hotspots and Threading with user-mode sampling
* Hotspots with HW event-based sampling, HPC Performance Characterization, etc.
* Microarchitecture Exploration
* Memory Access
* Hotspots with HW event-based sampling and call stacks
* Threading with HW event-based sampling

The following analyses have failed on the system:
* GPU Compute/Media Hotspots (characterization mode)
* GPU Compute/Media Hotspots (source analysis mode)

Log location: /tmp/vtune-tmp-root/self-checker-2022.10.15_14.27.41/log.txt
And this is the output when I try the default matrix demo on CLI:
[kevin@localhost bin64]$ ./vtune -collect uarch-exploration -r '/home/kevin/Documents/vtune_test'  /home/kevin/intel/vtune/samples/matrix/matrix
vtune: Warning: To enable hardware event-based sampling, VTune Profiler has disabled the NMI watchdog timer. The watchdog timer will be re-enabled after collection completes.
vtune: Collection started. To stop the collection, either press CTRL-C or enter from another console window: vtune -r /home/kevin/Documents/vtune_test -command stop.
Addr of buf1 = 0x7fe3f4f61010
Offs of buf1 = 0x7fe3f4f61180
Addr of buf2 = 0x7fe3f2f60010
Offs of buf2 = 0x7fe3f2f601c0
Addr of buf3 = 0x7fe3f0f5f010
Offs of buf3 = 0x7fe3f0f5f100
Addr of buf4 = 0x7fe3eef5e010
Offs of buf4 = 0x7fe3eef5e140
Threads #: 8 Pthreads
Matrix size: 2048
Using multiply kernel: multiply1
Execution time = 15.122 seconds
vtune: Collection stopped.
vtune: Using result path `/home/kevin/Documents/vtune_test'
vtune: Executing actions 19 % Resolving information for `ld-2.28.so'
vtune: Warning: Cannot locate file `nft_counter.ko'.
vtune: Executing actions 19 % Resolving information for `nft_counter'
vtune: Warning: Cannot locate file `bridge.ko'.
vtune: Executing actions 19 % Resolving information for `matrix'
vtune: Warning: Cannot locate file `r8169.ko'.
vtune: Executing actions 19 % Resolving information for `r8169'
vtune: Warning: Cannot locate file `nf_tables.ko'.
vtune: Executing actions 19 % Resolving information for `nf_tables'
vtune: Warning: Cannot locate file `nf_conntrack.ko'.
vtune: Executing actions 21 % Resolving information for `libc-2.28.so'
vtune: Warning: Cannot locate file `nft_ct.ko'.
vtune: Executing actions 21 % Resolving information for `nft_ct'
vtune: Warning: Cannot locate debugging information for file `/usr/lib64/libc-2.28.so'.
vtune: Warning: Cannot locate file `drm.ko'.
vtune: Executing actions 21 % Resolving information for `drm'
vtune: Warning: Cannot locate file `kvm.ko'.
vtune: Executing actions 22 % Resolving information for `kvm'
vtune: Warning: Cannot locate file `xfs.ko'.
vtune: Executing actions 22 % Resolving information for `xfs'
vtune: Warning: Cannot locate file `i915.ko'.
vtune: Executing actions 22 % Resolving information for `i915'
vtune: Warning: Cannot locate file `sep5.ko'.
vtune: Executing actions 22 % Resolving information for `vmlinux'
vtune: Warning: Function and source-level analysis for the Linux kernel will not be possible since neither debug version of the kernel nor kernel symbol tables are found. See the Enabling Linux Kernel Analysis topic in the product online help for instructions.
vtune: Executing actions 75 % Generating a report                              Elapsed Time: 15.135s
    Clockticks: 0
        P-Core: 0
        E-Core: 0
    Instructions Retired: 69,798,000,000
        P-Core: 0
        E-Core: 0
    CPI Rate: 0.000
        P-Core: 0.000
        E-Core: 0.000
    MUX Reliability: 0.000
     | Precision of collected HW event data is not enough. Metrics data may be
     | unreliable. Consider increasing your application execution time, using
     | the multiple runs mode instead of event multiplexing, or creating a
     | custom analysis with a limited subset of HW events. If you are using a
     | driverless collection, consider reducing the value of
     | /sys/bus/event_source/devices/cpu/perf_event_mux_interval_ms file.
     |
    P-Core
        Retiring: 0.0% of Pipeline Slots
            Light Operations: 0.0% of Pipeline Slots
                FP Arithmetic: 0.0% of uOps
                    FP x87: 0.0% of uOps
                    FP Scalar: 0.0% of uOps
                    FP Vector: 0.0% of uOps
                Memory Operations: 0.0% of Pipeline Slots
                Fused Instructions: 0.0% of Pipeline Slots
                Non Fused Branches: 0.0% of Pipeline Slots
                Nop Instructions: 0.0% of Pipeline Slots
                Other: 0.0% of Pipeline Slots
            Heavy Operations: 0.0% of Pipeline Slots
                Microcode Sequencer: 0.0% of Pipeline Slots
                    Assists: 0.0% of Pipeline Slots
                    CISC: 0.0% of Pipeline Slots
        Front-End Bound: 0.0% of Pipeline Slots
            Front-End Latency: 0.0% of Pipeline Slots
                ICache Misses: 0.0% of Clockticks
                ITLB Overhead: 0.0% of Clockticks
                Branch Resteers: 0.0% of Clockticks
                    Mispredicts Resteers: 0.0% of Clockticks
                    Clears Resteers: 0.0% of Clockticks
                    Unknown Branches: 0.0% of Clockticks
                DSB Switches: 0.0% of Clockticks
                Length Changing Prefixes: 0.0% of Clockticks
                MS Switches: 0.0% of Clockticks
            Front-End Bandwidth: 0.0% of Pipeline Slots
                Front-End Bandwidth MITE: 0.0% of Pipeline Slots
                    Decoder-0 Alone: 0.0% of Clockticks
                Front-End Bandwidth DSB: 0.0% of Pipeline Slots
                Front-End Bandwidth LSD: 0.0% of Pipeline Slots
                (Info) DSB Coverage: 0.0%
                (Info) LSD Coverage: 0.0%
                (Info) DSB Misses Cost: 0.0% of Pipeline Slots
        Bad Speculation: 100.0% of Pipeline Slots
         | A significant proportion of pipeline slots containing useful work are
         | being cancelled. This can be caused by mispredicting branches or by
         | machine clears. Note that this metric value may be highlighted due to
         | Branch Resteers issue.
         |
            Branch Mispredict: 0.0% of Pipeline Slots
            Machine Clears: 100.0% of Pipeline Slots
             | Issue: A significant portion of execution time is spent handling
             | machine clears.
             |
             | Tips: See the "Memory Disambiguation" section in the Intel 64 and
             | IA-32 Architectures Optimization Reference Manual.
             |
        Back-End Bound: 0.0% of Pipeline Slots
            Memory Bound: 0.0% of Pipeline Slots
                L1 Bound: 0.0% of Clockticks
                    DTLB Overhead: 0.0% of Clockticks
                        Load STLB Hit: 0.0% of Clockticks
                        Load STLB Miss: 0.0% of Clockticks
                    Loads Blocked by Store Forwarding: 0.0% of Clockticks
                    Lock Latency: 0.0% of Clockticks
                    Split Loads: 0.0% of Clockticks
                    FB Full: 0.0% of Clockticks
                L2 Bound: 0.0% of Clockticks
                L3 Bound: 0.0% of Clockticks
                    Contested Accesses: 0.0% of Clockticks
                    Data Sharing: 0.0% of Clockticks
                    L3 Latency: 0.0% of Clockticks
                    SQ Full: 0.0% of Clockticks
                DRAM Bound: 0.0% of Clockticks
                    Memory Bandwidth: 0.0% of Clockticks
                    Memory Latency: 0.0% of Clockticks
                Store Bound: 0.0% of Clockticks
                    Store Latency: 0.0% of Clockticks
                    False Sharing: 0.0% of Clockticks
                    Split Stores: 0.0% of Clockticks
                    Streaming Stores: 0.0% of Clockticks
                    DTLB Store Overhead: 0.0% of Clockticks
                        Store STLB Hit: 0.0% of Clockticks
                        Store STLB Hit: 0.0% of Clockticks
            Core Bound: 0.0% of Pipeline Slots
                Divider: 0.0% of Clockticks
                Port Utilization: 0.0% of Clockticks
                    Cycles of 0 Ports Utilized: 0.0% of Clockticks
                        Serializing Operations: 0.0% of Clockticks
                            Slow Pause: 0.0% of Clockticks
                            Memory Fence: 0.0% of Clockticks
                        Mixing Vectors: 0.0% of Clockticks
                    Cycles of 1 Port Utilized: 0.0% of Clockticks
                    Cycles of 2 Ports Utilized: 0.0% of Clockticks
                    Cycles of 3+ Ports Utilized: 0.0% of Clockticks
                        ALU Operation Utilization: 0.0% of Clockticks
                            Port 0: 0.0% of Clockticks
                            Port 1: 0.0% of Clockticks
                            Port 6: 0.0% of Clockticks
                        Load Operation Utilization: 0.0% of Clockticks
                        Store Operation Utilization: 0.0% of Clockticks
    E-Core
        Retiring: 0.0% of Pipeline Slots
            General Retirement: 0.0% of Pipeline Slots
                FP Arithmetic: 0.0% of Pipeline Slots
                Other: 0.0% of Pipeline Slots
            Microcode Sequencer: 0.0% of Pipeline Slots
        Front-End Bound: 0.0% of Pipeline Slots
            Front-End Latency: 0.0% of Pipeline Slots
                ICache Misses: 0.0% of Pipeline Slots
                ITLB Overhead: 0.0% of Pipeline Slots
                BACLEARS: 0.0% of Pipeline Slots
                Branch Resteers: 0.0% of Pipeline Slots
            Front-End Bandwidth: 0.0% of Pipeline Slots
                Cisc: 0.0% of Pipeline Slots
                Decode: 0.0% of Pipeline Slots
                Pre-Decode Wrong: 0.0% of Pipeline Slots
                Front-End Other: 0.0% of Pipeline Slots
        Bad Speculation: 0.0% of Pipeline Slots
            Branch Mispredict: 0.0% of Pipeline Slots
            Machine Clears: 0.0% of Pipeline Slots
                Machine Clear: 0.0% of Pipeline Slots
                MO Machine Clear Overhead: 0.0% of Pipeline Slots
        Back-End Bound: 0.0% of Pipeline Slots
            Resource Bound: 0.0% of Pipeline Slots
                Memory Scheduler: 0.0% of Pipeline Slots
                Non-memory Scheduler: 0.0% of Pipeline Slots
                Register: 0.0% of Pipeline Slots
                Full Re-order Buffer (ROB): 0.0% of Pipeline Slots
                Allocation Restriction: 0.0% of Pipeline Slots
                Serializing Operations: 0.0% of Pipeline Slots
        Alternative Back-End Bound: 0.0% of Pipeline Slots
            Core Bound: 0.0%
            Memory Bound: 0.0%
                L2 Bound: 0.0%
                L3 Bound: 0.0%
                DRAM Bound: 0.0%
    Average CPU Frequency: 0.000 MHz
    Total Thread Count: 9
    Paused Time: 0s
Effective Physical Core Utilization: 0.0% (0.000 out of 6)
 | The metric value is low, which may signal a poor physical CPU cores
 | utilization caused by:
 |     - load imbalance
 |     - threading runtime overhead
 |     - contended synchronization
 |     - thread/process underutilization
 |     - incorrect affinity that utilizes logical cores instead of physical
 |       cores
 | Explore sub-metrics to estimate the efficiency of MPI and OpenMP parallelism
 | or run the Locks and Waits analysis to identify parallel bottlenecks for
 | other parallel runtimes.
 |
    Effective Logical Core Utilization: 63.8% (7.653 out of 12)
     | The metric value is low, which may signal a poor logical CPU cores
     | utilization. Consider improving physical core utilization as the first
     | step and then look at opportunities to utilize logical cores, which in
     | some cases can improve processor throughput and overall performance of
     | multi-threaded applications.
     |
Collection and Platform Info
    Application Command Line: /home/kevin/intel/vtune/samples/matrix/matrix
    User Name: kevin
    Operating System: 4.18.0-372.19.1.el8_6.x86_64 Red Hat Enterprise Linux release 8.6 (Ootpa)
    Computer Name: localhost.localdomain
    Result Size: 305.1 MB
    Collection start time: 12:13:29 15/10/2022 UTC
    Collection stop time: 12:13:44 15/10/2022 UTC
    Collector Type: Event-based sampling driver
    CPU
        Name: Intel(R) microarchitecture code named Alderlake-S
        Frequency: 2.995 GHz
        Logical CPU Count: 12
        Cache Allocation Technology
            Level 2 capability: available
            Level 3 capability: not detected

If you want to skip descriptions of detected performance issues in the report,
enter: vtune -report summary -report-knob show-issues=false -r <my_result_dir>.
Alternatively, you may view the report in the csv format: vtune -report
<report_name> -format=csv.
vtune: Executing actions 100 % done
- Mark as New
- Bookmark
- Subscribe
- Mute
- Subscribe to RSS Feed
- Permalink
- Report Inappropriate Content
I am experiencing the same issue on an AlderLake system.
Below are the results of running self-check:
Intel(R) VTune(TM) Profiler Self Check Utility
Copyright (C) 2009 Intel Corporation. All rights reserved.
Build Number: 624343
HW event-based analysis (counting mode) (Intel driver)
Example of analysis types: Performance Snapshot
Collection: Ok
Finalization: Ok...
Report: Ok
Instrumentation based analysis check
Example of analysis types: Hotspots and Threading with user-mode sampling
Collection: Ok
Finalization: Ok...
Report: Ok
HW event-based analysis check (Intel driver)
Example of analysis types: Hotspots with HW event-based sampling, HPC Performance Characterization, etc.
Collection: Ok
Finalization: Ok...
Report: Ok
HW event-based analysis check (Intel driver)
Example of analysis types: Microarchitecture Exploration
Collection: Ok
Finalization: Ok...
Report: Ok
HW event-based analysis with uncore events (Intel driver)
Example of analysis types: Memory Access
Collection: Ok
Finalization: Ok...
Report: Ok
HW event-based analysis with stacks (Intel driver)
Example of analysis types: Hotspots with HW event-based sampling and call stacks
Collection: Ok
vtune: Warning: Stack flow analysis on this platform is limited to the hardware LBR-based stack type that has a depth limitation.
Finalization: Ok...
Report: Ok
HW event-based analysis with context switches (Intel driver)
Example of analysis types: Threading with HW event-based sampling
Collection: Ok
Finalization: Ok...
Report: Ok
Checking DPC++ application as prerequisite for GPU analyses: Fail
Unable to run DPC++ application on GPU connected to this system. If you are using an Intel GPU and want to verify profiling support for DPC++ applications, check these requirements:
* Install Intel(R) GPU driver.
* Install Intel(R) Level Zero GPU runtime.
* Install Intel(R) oneAPI DPC++ Runtime and set the environment.
The system is ready to be used for performance analysis with Intel VTune Profiler.
Review warnings in the output above to find product limitations, if any.
The system is ready for the following analyses:
* Performance Snapshot
* Hotspots and Threading with user-mode sampling
* Hotspots with HW event-based sampling, HPC Performance Characterization, etc.
* Microarchitecture Exploration
* Memory Access
* Hotspots with HW event-based sampling and call stacks
* Threading with HW event-based sampling
The following analyses have failed on the system:
* GPU Compute/Media Hotspots (characterization mode)
* GPU Compute/Media Hotspots (source analysis mode)
- Mark as New
- Bookmark
- Subscribe
- Mute
- Subscribe to RSS Feed
- Permalink
- Report Inappropriate Content
Hi All,
Good day to you all.
Can you please follow the below steps?
1. Please let us know whether you were able to reproduce the same issue with the latest version of Vtune, i.e., 2022. 4
2. Can you please share your result directory where you were getting that error as a zip file? (The result directory looks like: r000XX.)
Thanks,
Jaideep
- Mark as New
- Bookmark
- Subscribe
- Mute
- Subscribe to RSS Feed
- Permalink
- Report Inappropriate Content
Thanks. Yes I.m using Vtune 2022.4.0 build 624343.
Please find the result directory below.
Please let me know next steps.
Max
- Mark as New
- Bookmark
- Subscribe
- Mute
- Subscribe to RSS Feed
- Permalink
- Report Inappropriate Content
Hi,
Please find attached results
I can confirm i am already using 2022.4 and i'm having the same issues.
Oliver
- Mark as New
- Bookmark
- Subscribe
- Mute
- Subscribe to RSS Feed
- Permalink
- Report Inappropriate Content
Hi All,
Thank you for sharing the log files, we are working on this internally and get back to you with an update.
Regards,
Jaideep
- Mark as New
- Bookmark
- Subscribe
- Mute
- Subscribe to RSS Feed
- Permalink
- Report Inappropriate Content
Hi All,
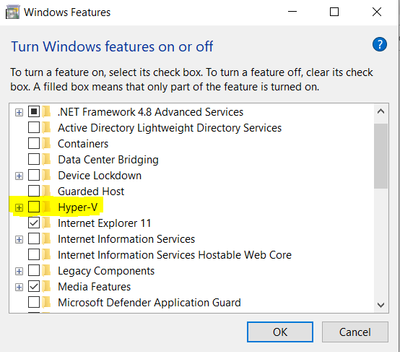
The issue is known issue on VTune product when the system runs on Hyper-V because Hyper-V blocks non-converged PMU feature on hetero platforms.
Can you please disable Hyper-V in Windows features and let us know if the issue still persists. Please attach the results after disabling Hyper-V.
Thanks,
Jaideep
- Mark as New
- Bookmark
- Subscribe
- Mute
- Subscribe to RSS Feed
- Permalink
- Report Inappropriate Content
Hi Jaideep,
I already thought that could be an issue and checked it wasn't on and it isn't, I also turned off virtulisation and it also didnt make a difference.
Thanks again,
Oliver
- Mark as New
- Bookmark
- Subscribe
- Mute
- Subscribe to RSS Feed
- Permalink
- Report Inappropriate Content
Hi Jaideep,
Looking at what you said I had to go one step further, I turned Intel Virtulisation (VMX) off in the BIOS and that has made me able to see P-core performance in Microarchitecture exploration now. (resolved the issue).
Maybe theres some virtulisation option that needs to be reset after setting hyper-v.
For any one else following this post I would suggest disabling virtulisation off in the BIOS and see if that works for you.
Regards,
Oliver
- Mark as New
- Bookmark
- Subscribe
- Mute
- Subscribe to RSS Feed
- Permalink
- Report Inappropriate Content
Hi Jaideep,
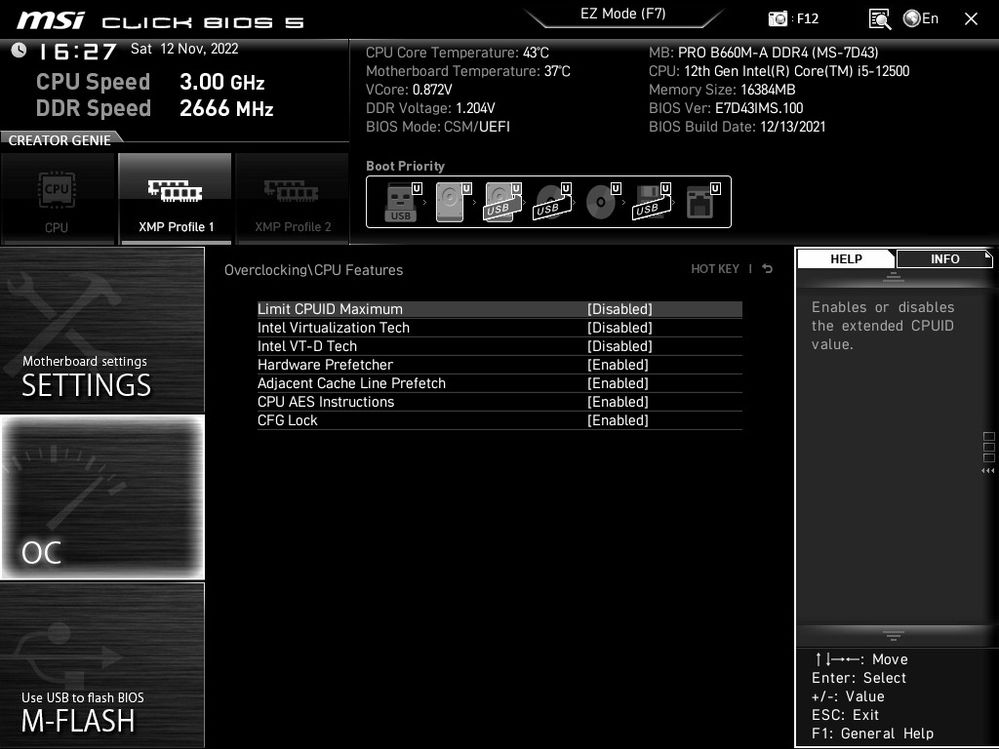
I have tried to follow the advice and I have disabled virtualization in BIOS (as can be seen in the screenshot below), but I still have the same issue, I'm attaching results of the microarchitecture analysis.
I'm not running Windows, I'm running Linux (RHEL8). Is there something I need to change in my OS settings?
Both "Intel Virtualization Tech" and "Intel VT-D Tech" is disabled:
- Mark as New
- Bookmark
- Subscribe
- Mute
- Subscribe to RSS Feed
- Permalink
- Report Inappropriate Content
- Mark as New
- Bookmark
- Subscribe
- Mute
- Subscribe to RSS Feed
- Permalink
- Report Inappropriate Content
If I turn off virtualization in the BIOS as Oliver did, I am able to see P-Core counts.
That is decent news. I can proceed with this limitation.
Will this issue be addressed? I would prefer to have Virtualization turned on by default and not have to turn it off everytime I want to use VTune.
Thanks,
Max
- Mark as New
- Bookmark
- Subscribe
- Mute
- Subscribe to RSS Feed
- Permalink
- Report Inappropriate Content
Hi All,
Thank you for sharing your observation and the log files. We are working on this internally and will get back to you with an update.
Regards,
Jaideep
- Mark as New
- Bookmark
- Subscribe
- Mute
- Subscribe to RSS Feed
- Permalink
- Report Inappropriate Content
Hi All,
Turning off virtualization in the BIOS settings can show PCORE values (This issue can be seen on some alder lake platforms). If this resolves your issue, make sure to accept this as a solution. This would help others with similar issue. Thank you!
Regards,
Jaideep
- Mark as New
- Bookmark
- Subscribe
- Mute
- Subscribe to RSS Feed
- Permalink
- Report Inappropriate Content
Hello Jaideep, as I have previously stated, this did NOT solve my issue. As can be seen in attached screenshot, virtualization in BIOS is disabled, but still microarchitecture analysis does not show values for P cores.
OS: RHEL8
Is there anything I can try next?
- Mark as New
- Bookmark
- Subscribe
- Mute
- Subscribe to RSS Feed
- Permalink
- Report Inappropriate Content
Hi,
Could you please attach the screen shots of your system info output.
Thanks,
Jaideep
- Subscribe to RSS Feed
- Mark Topic as New
- Mark Topic as Read
- Float this Topic for Current User
- Bookmark
- Subscribe
- Printer Friendly Page
