- Mark as New
- Bookmark
- Subscribe
- Mute
- Subscribe to RSS Feed
- Permalink
- Report Inappropriate Content
Hello all,
I am trying to run a hotspot analysis on a program that I am obviously trying to optimize and it isn't giving me much data at all to work with. I am hopeful that someone on the forums can help me with my problem.
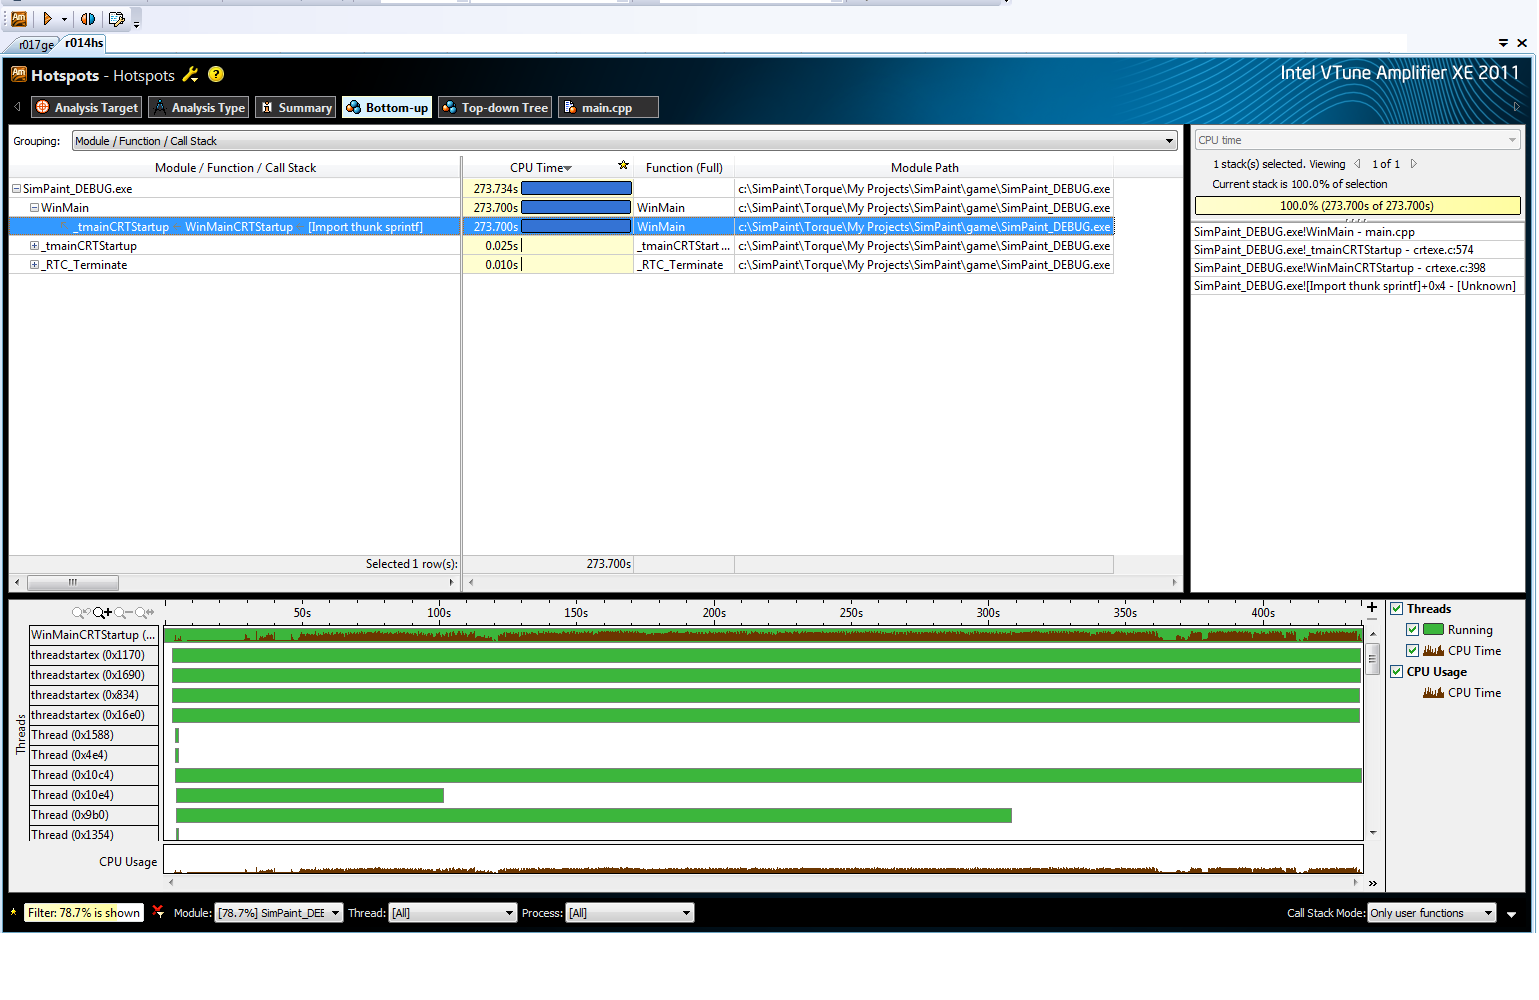
I attached a picture of the hotspot analysis results that I am getting. I am filtering the results to limit to my executable only.
To try and help you help me, all of our code is being generated into a dll which the main exe uses. I am running VS 2008 and VTune Amp XE 2011. I am hoping it is some option I can change in VS and/or VTune. You will probably need more information than that but I am not sure what would be useful so let me know.
Thanks for any reading and any help.
-Zach
I am trying to run a hotspot analysis on a program that I am obviously trying to optimize and it isn't giving me much data at all to work with. I am hopeful that someone on the forums can help me with my problem.
I attached a picture of the hotspot analysis results that I am getting. I am filtering the results to limit to my executable only.
To try and help you help me, all of our code is being generated into a dll which the main exe uses. I am running VS 2008 and VTune Amp XE 2011. I am hoping it is some option I can change in VS and/or VTune. You will probably need more information than that but I am not sure what would be useful so let me know.
Thanks for any reading and any help.
-Zach
Link Copied
1 Reply
- Mark as New
- Bookmark
- Subscribe
- Mute
- Subscribe to RSS Feed
- Permalink
- Report Inappropriate Content
Hi Zach,
I saw therewere many threads working in your report, but "CPU Usage"washigh only in main thread. It did mean most of works were in main thread, you may adjust workloadindifferent thread (move works in main threads to others?)
My opinion is to use Concurrency Analysis to see parallelsim(for hot functions) - our goal is that all works are balanced in different core/thread. Then use Locksandwaits Analysis to find any sync objectwhich causes threads' stall.
Final step, you can tune application in microarchitecture level - please refer to this article(although the article was for old VTune Analyzer, but events are same for i7 processors)
Regards, Peter
Reply
Topic Options
- Subscribe to RSS Feed
- Mark Topic as New
- Mark Topic as Read
- Float this Topic for Current User
- Bookmark
- Subscribe
- Printer Friendly Page