- Mark as New
- Bookmark
- Subscribe
- Mute
- Subscribe to RSS Feed
- Permalink
- Report Inappropriate Content
It seems that "VTune Amplifier XE 2016 Update1" consumes sample buffer even while it is paused
"The specified data limit of 500 MB is reached. Data collection is stopped." even before I Resume collection, and be able to start profiling.
I would like to delay sample collection untill the point my application is fully loaded and initialized, but have to specify too big sample data buffer over 1GB which is extremely slow at the later processing time.
Link Copied
- Mark as New
- Bookmark
- Subscribe
- Mute
- Subscribe to RSS Feed
- Permalink
- Report Inappropriate Content
Hi Timur:
How did you begin the data collection, that is, how did you configure VTune Amplifier to start?
- Mark as New
- Bookmark
- Subscribe
- Mute
- Subscribe to RSS Feed
- Permalink
- Report Inappropriate Content
Created a New Analysis:
Type: Hotspot, call counts, stacks, and context switches
in Analysis Target page:
left both checkboxes unchecked:
Automatically resume collection after (sec):
Automatically stop collection after (sec):
And then clicked "Start Paused" button, application starts, buttons show state is paused, (Resume button unpressed)
Tried also to check Automatically resume collection after (sec): and put there big number, like 5000 seconds, results was the same, after a minute or so, got error that data limit reached.
- Mark as New
- Bookmark
- Subscribe
- Mute
- Subscribe to RSS Feed
- Permalink
- Report Inappropriate Content
After I get this "The specified data limit of 500 MB is reached. Data collection is stopped. warning,
when pressing Stop button, Vtune goes to analyze data, and report that no data was collected
Elapsed Time
:
25.048s
No data to show. The collected data is not sufficient.
Top Hotspots
This section lists the most active functions in your application. Optimizing these hotspot functions typically results in improving overall application performance.
No data to show. The collected data is not sufficient.
CPU Usage Histogram
This histogram displays a percentage of the wall time the specific number of CPUs were running simultaneously. Spin and Overhead time adds to the Idle CPU usage value.
No data to show. The collected data is not sufficient.
Collection and Platform Info
This section provides information about this collection, including result set size and collection platform data.
Application Command Line
:
F:\ce\bin\win_x64\GameSDK.exe
Operating System
:
Microsoft Windows 10
Computer Name
:
Result Size
:
180 MB
Collection start time
:
20:09:01 05/11/2015 UTC
Collection stop time
:
20:09:26 05/11/2015 UTC
CPU
Name
:
4th generation Intel(R) Core(TM) Processor family
Frequency
:
3.4 GHz
Logical CPU Count
:
8
- Mark as New
- Bookmark
- Subscribe
- Mute
- Subscribe to RSS Feed
- Permalink
- Report Inappropriate Content
okay, thanks. can you try again, but this time don't add anything to the Advanced Hotspots, e.g., don't check call stacks, call counts or any of that. Just do a plain old Advanced Hotspots. Do you see the same problem?
- Mark as New
- Bookmark
- Subscribe
- Mute
- Subscribe to RSS Feed
- Permalink
- Report Inappropriate Content
With plain Hotspots it doesnt happen, seems to work correctly
- Mark as New
- Bookmark
- Subscribe
- Mute
- Subscribe to RSS Feed
- Permalink
- Report Inappropriate Content
Actually happens with Plain Hotspots too, probably just much slower
if I set buffer size to 5MB, and CPU Sampling Interval to 0.01ms, get same kind of overflow on plain Hotspots within seconds
- Mark as New
- Bookmark
- Subscribe
- Mute
- Subscribe to RSS Feed
- Permalink
- Report Inappropriate Content
okay, one thing I noticed when I attempted to duplicate your issue, which I did, is this message:
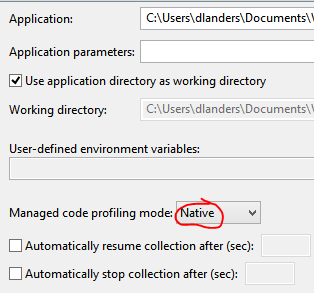
So, what is happening is that the default setting is to automatically detect managed code, e.g., .NET* and Java*. However, because of that, it still collects some information during the paused time. The solution is to change the setting in the project configuration to "Native", e.g.
There is still a finite amount of info saved at the beginning of the paused collection phase, but I don't believe it is growing and you shouldn't hit the limit. Please try that and let us know if it helps.
- Mark as New
- Bookmark
- Subscribe
- Mute
- Subscribe to RSS Feed
- Permalink
- Report Inappropriate Content
- Mark as New
- Bookmark
- Subscribe
- Mute
- Subscribe to RSS Feed
- Permalink
- Report Inappropriate Content
okay, but don't "set buffer size to 5MB, and CPU Sampling Interval to 0.01ms"! That is not realistic.
I realize the tool is doing something unexpected and I will submit a defect report. However, if you want to use the tool, then a workaround should be acceptable. Please reset the data limit and the sampling interval and try again.
- Subscribe to RSS Feed
- Mark Topic as New
- Mark Topic as Read
- Float this Topic for Current User
- Bookmark
- Subscribe
- Printer Friendly Page

