- Mark as New
- Bookmark
- Subscribe
- Mute
- Subscribe to RSS Feed
- Permalink
- Report Inappropriate Content
I have use vtune to profile one of my application. It runs in 3 threads. I find some inconsistency in the top-down results.
In top-down, 'univmon_processing' takes 24.1% and 4.97s, where the sub-functions are 'heapify', 'find', 'XXH32', 'MedianOfFive'. However, the add-up cpu portion of sub-functions are less than 24.1%, and the add-up cpu time of sub-functions are greater than 4.97s.
I am wondering how to understand the result.
Thanks!
Link Copied
- Mark as New
- Bookmark
- Subscribe
- Mute
- Subscribe to RSS Feed
- Permalink
- Report Inappropriate Content
Hi,
Good day to you.
Thanks for posting in Intel Communities.
While profiling an application in Intel VTune, kindly note the following:
- The metrices provided by a function call stack might not always be cumulative. For example, it might have happened that a function is being called by some other function along with it.
- Intel VTune profiler works by sampling and numbers are less accurate for short run times. If your application runs for a noticeably short duration, you could consider using "allow multiple runs" in VTune or increasing the run time to improve the precision of the collected results.
- https://www.intel.com/content/www/us/en/develop/documentation/vtune-help/top/analyze-performance/hw-event-based-sampling-collection/allow-multiple-runs-or-multiplex-events.html
- https://www.intel.com/content/www/us/en/develop/documentation/vtune-help/top/command-line-interface/command-line-interface-reference/allow-multiple-runs.html
- Additionally, Intel VTune Profiler sometimes rounds off the numbers so it might not give ideal result, but the difference is small (like 0.1%).
>> I am wondering how to understand the result.
Kindly refer to the links below to get more information regarding Intel VTune profiler in detail:
https://www.intel.com/content/www/us/en/develop/documentation/vtune-help/top/reference.html
https://www.intel.com/content/www/us/en/develop/documentation/vtune-help/top.html
https://www.intel.com/content/dam/develop/external/us/en/documents/vtune-profiler-user-guide.pdf
Regards,
Jyothis V James
- Mark as New
- Bookmark
- Subscribe
- Mute
- Subscribe to RSS Feed
- Permalink
- Report Inappropriate Content
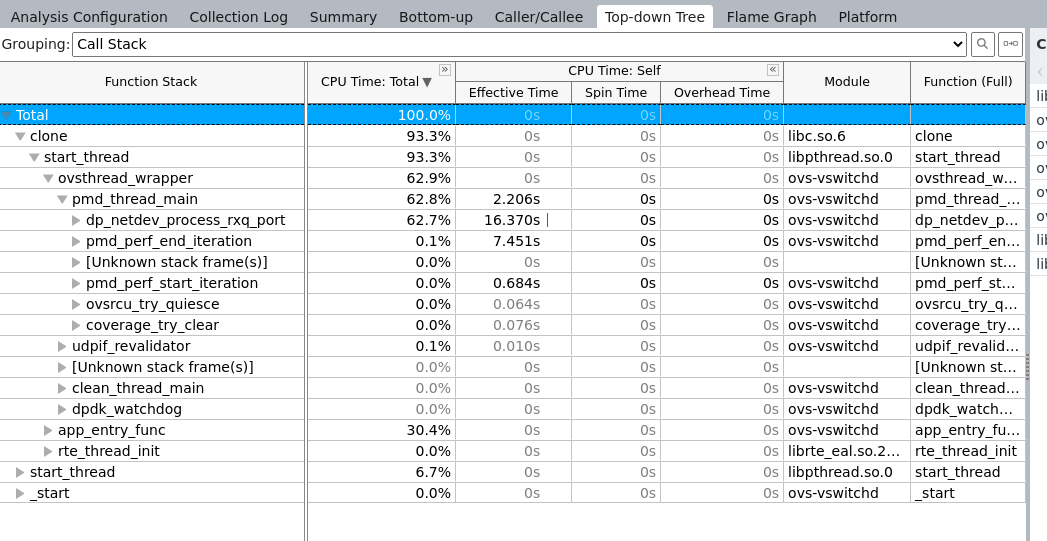
I also try to run the program over one hour. However, in the "top-down tree" category, many field is 0s, which it says that there is not enough samples to calculate that metric.
Also, the effective time is also much smaller than the one in the "top hotspots".
- Mark as New
- Bookmark
- Subscribe
- Mute
- Subscribe to RSS Feed
- Permalink
- Report Inappropriate Content
Thanks for the reply. I try to increase sampling numbers by adding sampling-interval. However, I get the following error. What is wrong here?
./vtune -collect hotspots -knob sampling-mode=hw -knob sampling-interval=0.01 -target-pid 11850
vtune: Warning: To enable hardware event-based sampling, VTune Profiler has disabled the NMI watchdog timer. The watchdog timer will be re-enabled after collection completes.
Warning: sav for event INST_RETIRED.ANY is too low, value reset to 100000
Warning: sav for event CPU_CLK_UNHALTED.REF_TSC is too low, value reset to 100000
Warning: sav for event INST_RETIRED.ANY is too low, value reset to 100000
Warning: sav for event CPU_CLK_UNHALTED.REF_TSC is too low, value reset to 100000
Warning: sav for event INST_RETIRED.ANY is too low, value reset to 100000
Warning: sav for event CPU_CLK_UNHALTED.REF_TSC is too low, value reset to 100000
vtune: Collection started. To stop the collection, either press CTRL-C or enter from another console window: vtune -r /opt/intel/oneapi/vtune/2021.9.0/bin64/r025hs -command stop.
^CA tbX file was not created because 0 samples were collected
vtune: Collection detached.
vtune: Collection stopped.
vtune: Using result path `/opt/intel/oneapi/vtune/2021.9.0/bin64/r025hs'
vtune: Executing actions 100 % done
vtune: Error: 0x40000025 (Inapplicable report) -- The report 'summary' is not applicable to the result /opt/intel/oneapi/vtune/2021.9.0/bin64/r025hs/r025hs.vtune.
- Mark as New
- Bookmark
- Subscribe
- Mute
- Subscribe to RSS Feed
- Permalink
- Report Inappropriate Content
Hi,
Good day to you.
Can you get back with the following information to assist you better:
1. A sample reproducer code which can be used to replicate the issue from our side.
2. VTune version (in VTune GUI, click Menu > Help > About or in CLI, type vtune -V in a terminal window) and the OS which you are using
3. Output of the following commands:
$ sudo <vtune-install-dir>/sepdk/src/insmod-sep -r
$ sudo <vtune-install-dir>/sepdk/src/insmod-sep -q
$ sudo <vtune-install-dir>/bin64/vtune-self-checker.sh
Eg.:
sudo /opt/intel/oneapi/vtune/latest/sepdk/src/insmod-sep -r
sudo /opt/intel/oneapi/vtune/latest/sepdk/src/insmod-sep -q
sudo /opt/intel/oneapi/vtune/latest/bin64/vtune-self-checker.sh
Thanks and Regards,
Jyothis V James
- Mark as New
- Bookmark
- Subscribe
- Mute
- Subscribe to RSS Feed
- Permalink
- Report Inappropriate Content
Hi,
Good day to you.
We have not received any update from you. Is your issue resolved? If not, can you get back to us with the requested information?
To make the results more understandable to you. The "Top-down Tree" window explores the call sequence flow of the application and analyzes the time spent in each program unit and on its callees. In this view, the "Function Stack" column represents call sequences (stacks) detected during collection phase starting from the application root (usually, the main() function).
By default, all program units are sorted in a descending order by the metric values in the first column (for example, CPU Time: Total) providing the most performance-critical program units first. You may click any column header to re-sort the table by the required metric.
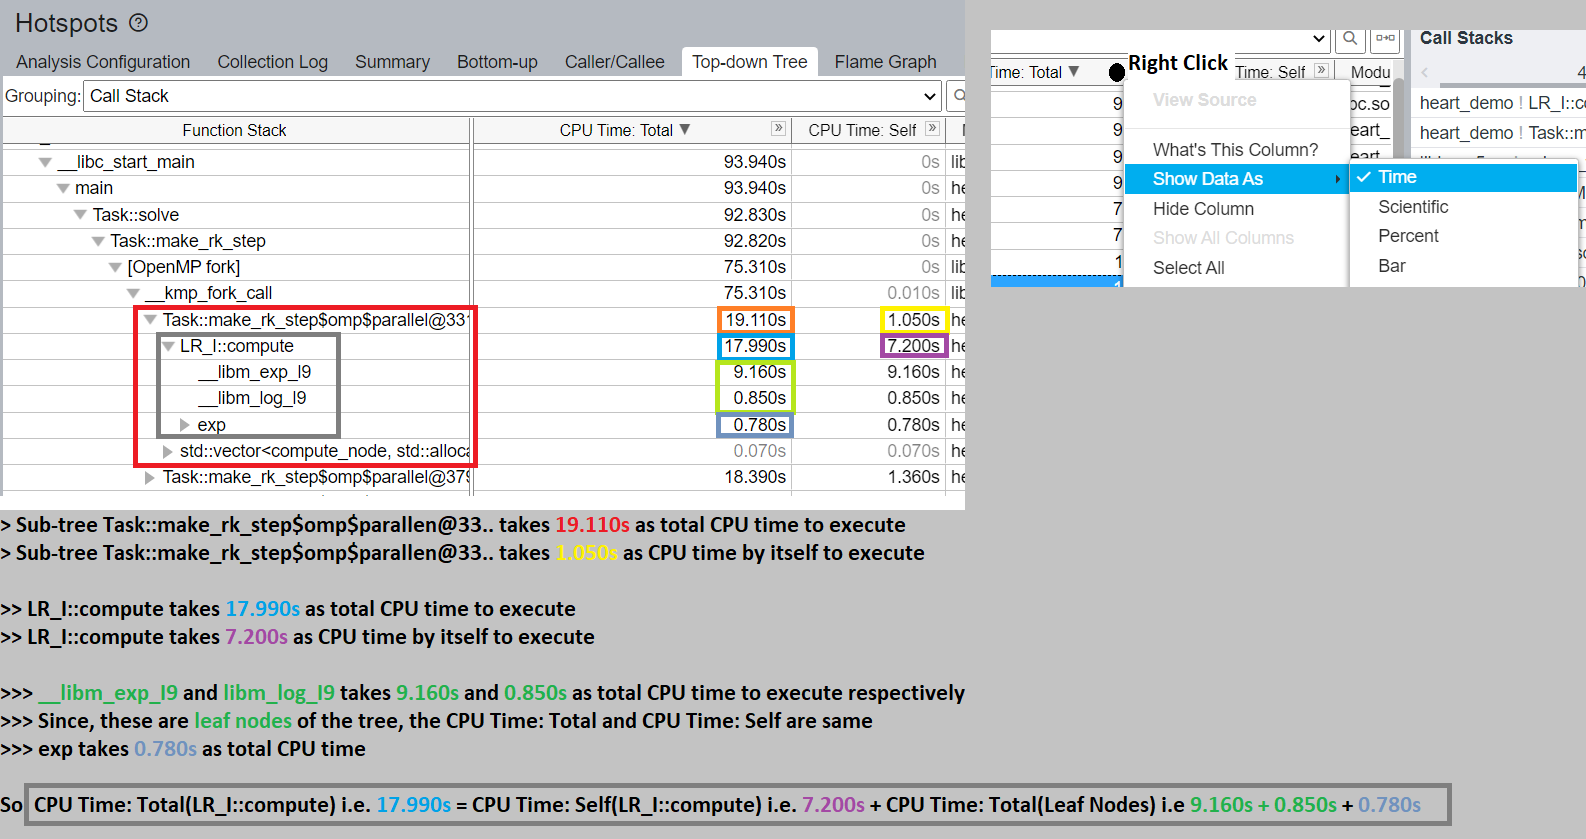
CPU Time is the time during which the CPU is actively executing your application. This is divided into Total and Self. Total-metrics show performance data collected within functions AND children (callees). Self-metrics show performance data collected within particular procedures and functions.
By default, the CPU Time: Total is displayed in percentage. You can right click on the header "CPU Time: Total" and select "Show Data As" from the menu and choose "Time" to view it in seconds. The "CPU Time: Total" metric is cumulative and follows the hierarchy of the that is followed by column with the header "Function Stack"
CPU Time: Total (Function) = CPU Time: Self (Function) + CPU Time: Total (Sub-Functions)
Kindly refer to the screenshot attached along with this email for more detailed information and explanation.
Thanks and Regards,
Jyothis V James
- Mark as New
- Bookmark
- Subscribe
- Mute
- Subscribe to RSS Feed
- Permalink
- Report Inappropriate Content
Hi,
Good day to you.
We have not heard back from you. Intel will no longer monitor this thread. If you need further assistance, please post a new question.
Thanks and Regards,
Jyothis V James
- Subscribe to RSS Feed
- Mark Topic as New
- Mark Topic as Read
- Float this Topic for Current User
- Bookmark
- Subscribe
- Printer Friendly Page