- Mark as New
- Bookmark
- Subscribe
- Mute
- Subscribe to RSS Feed
- Permalink
- Report Inappropriate Content
Link Copied
- Mark as New
- Bookmark
- Subscribe
- Mute
- Subscribe to RSS Feed
- Permalink
- Report Inappropriate Content
Hi Charles,
actually so as you use user-mode sampling collector it works from context of the target process (i.e. on the same cores as the process was pinned on). But so as amplxe-cl and amplxe-runss processes weren't pinned they can compete for unwanted cores.
you have to determine what exactly you want from this scheme, if you want that both amplxe-cl and theJob have the same CPU affinity mask then just replace taskset and amplxe-cl: taskset -c 0,2,4,6,8,10,12,14,16,18 amplxe-cl -collect threading theJob
also it will be useful to set -data-limit=0 so as the collection launcher will not create a thread to monitor result size.
If you really want to collect data only about some subset of available cores then you will need to switch to hardware-based event sampling and use -cpu-mask option. You can find details about this option here: https://software.intel.com/en-us/vtune-amplifier-help-cpu-mask . In this case you will get something like that:
amplxe-cl -collect threading -knob sampling-and-waits=hw -data-limit=0 -cpu-mask=0,2 taskset -c 0,2,4,6,8,10,12,14,16,18 theJob
BR,
Vladimir
- Mark as New
- Bookmark
- Subscribe
- Mute
- Subscribe to RSS Feed
- Permalink
- Report Inappropriate Content
- Mark as New
- Bookmark
- Subscribe
- Mute
- Subscribe to RSS Feed
- Permalink
- Report Inappropriate Content
Hi Charles,
could you please upload a result? it's very hard to analyze this by the picture.
BR,
Vladimir
- Mark as New
- Bookmark
- Subscribe
- Mute
- Subscribe to RSS Feed
- Permalink
- Report Inappropriate Content
- Mark as New
- Bookmark
- Subscribe
- Mute
- Subscribe to RSS Feed
- Permalink
- Report Inappropriate Content
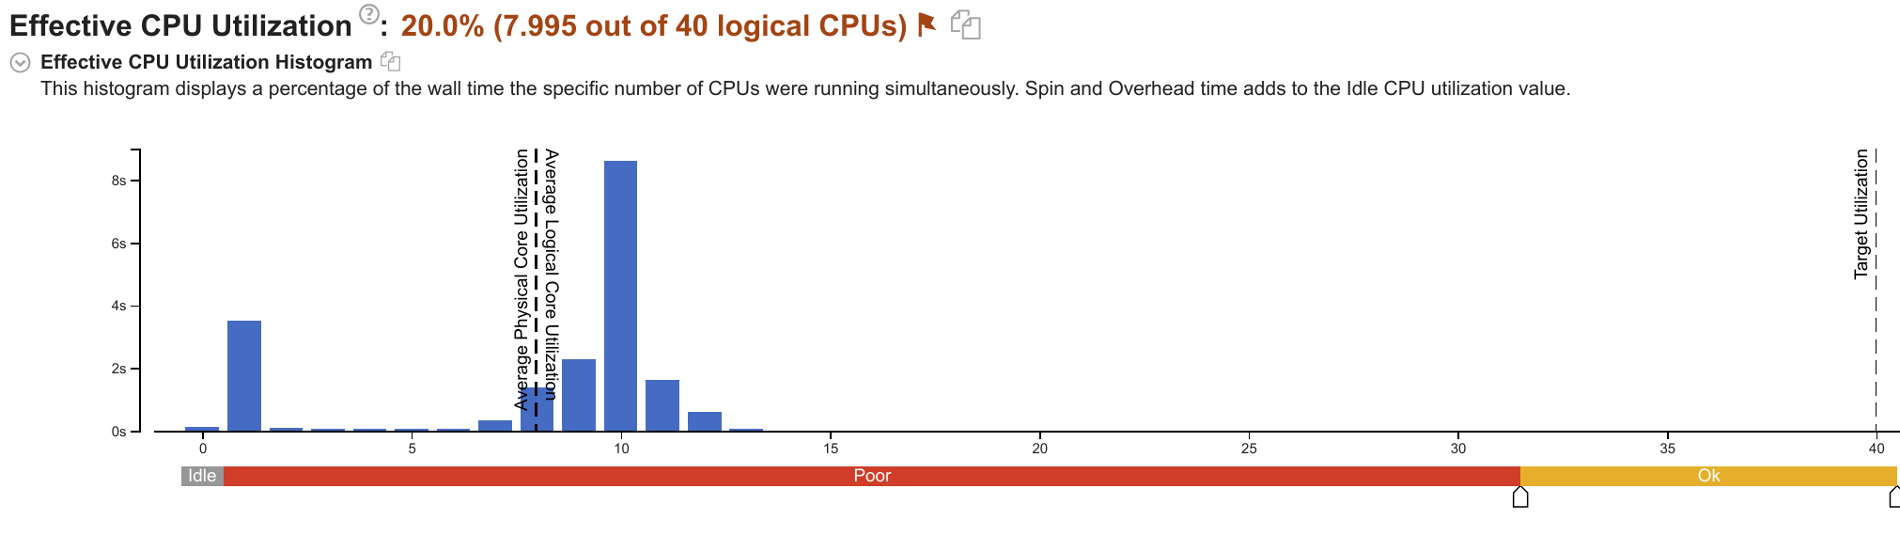
Hi Charles,
this seems on inaccuracy of sampling collection. Just imagine that you have 2 threads working on a single logic core, and one of threads was interrupted at a middle sampling point and execution was switched to another one. Then the new thread was executed during some time (10 ms , 2 samples has occurred in your case) and then it was preempted by the first one and a sample has happened on this thread too, its sampling interval is ~ 15 ms in this case with a small inaccuracy on a kernel work. Then you will have 100% CPU utilization for the 2nd thread during 10ms and ~ 33% utilization of the first thread and in result you see that more than 1 logic core was utilized during this time.
If you switch on Process/HW Context/Function/Thread/Call Stack grouping (this is a custom grouping) you will see that actually no thread were executed on cores different from you set.
I can suggest to disable call stacks and to decrease sampling interval to get more accurate data, of course if you need it. Disabling Call Stacks here will improve your situation because you will be switched to another collector which doesn't catch context switches.
BR,
Vladimir
- Subscribe to RSS Feed
- Mark Topic as New
- Mark Topic as Read
- Float this Topic for Current User
- Bookmark
- Subscribe
- Printer Friendly Page