- Mark as New
- Bookmark
- Subscribe
- Mute
- Subscribe to RSS Feed
- Permalink
- Report Inappropriate Content
Hi,
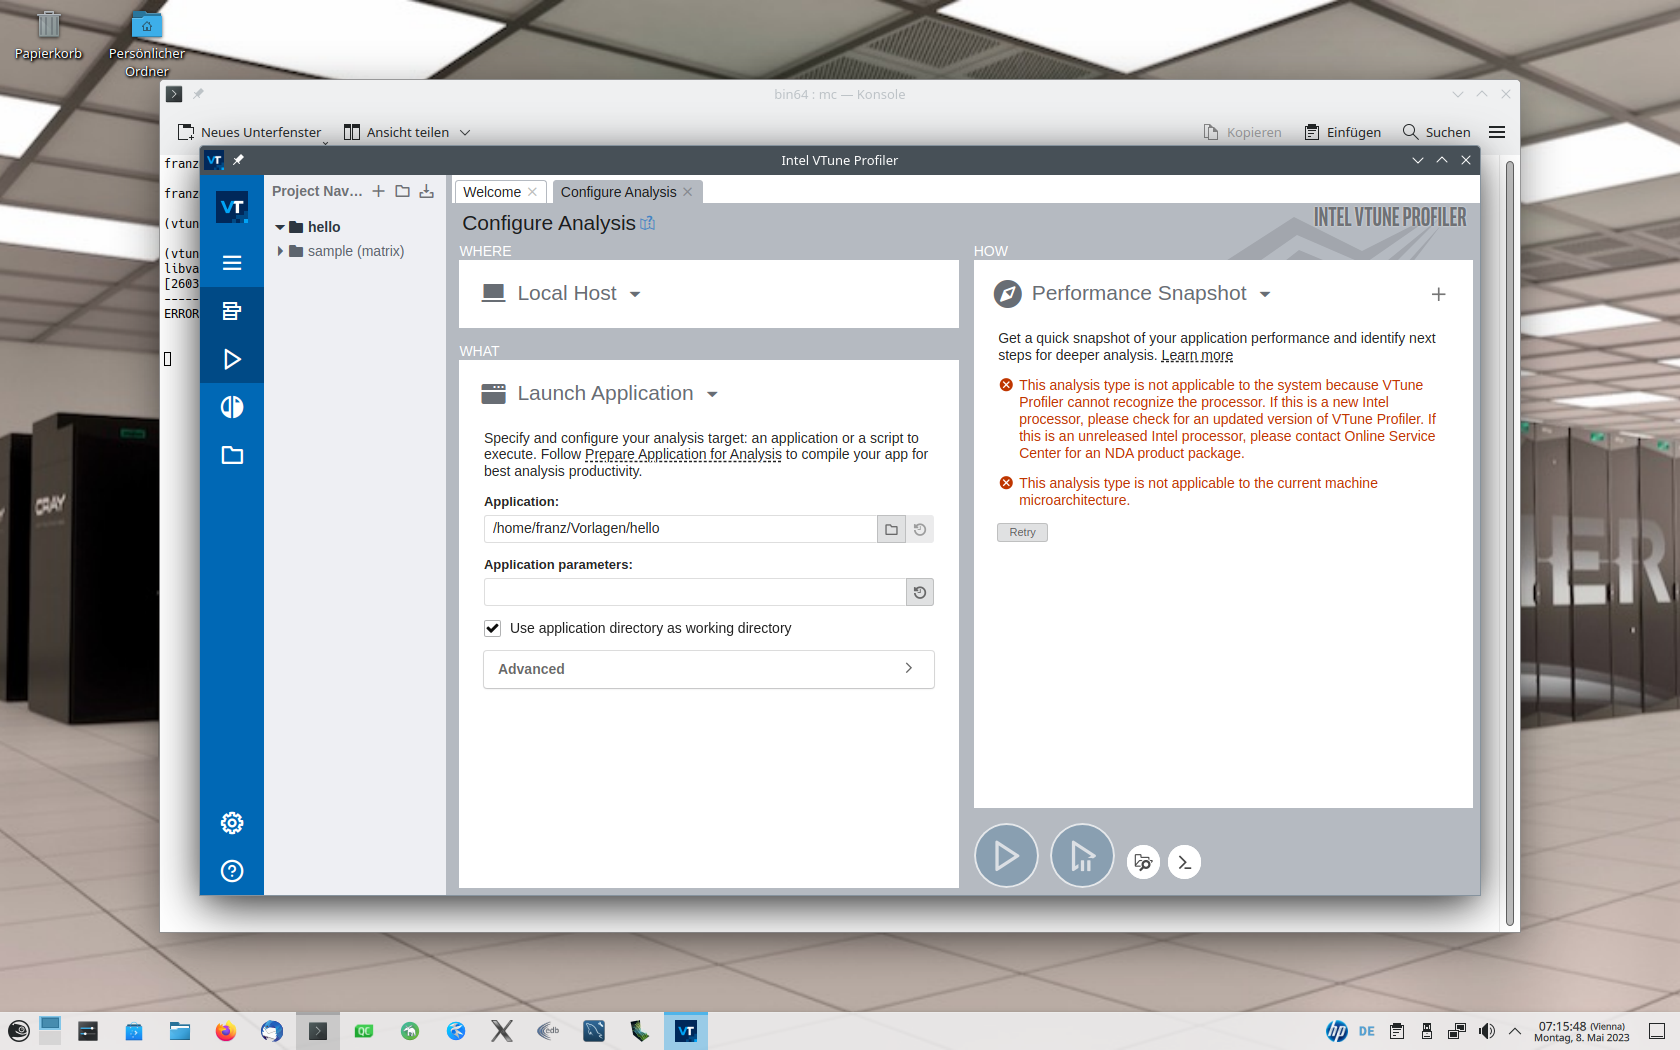
great Problem VTune (2023) does not work on my Dell Poweredge R720 Developer Server with 2 x Xeon E5-2680-0
does not detect the CPU's
regards
Franz
Link Copied
- Mark as New
- Bookmark
- Subscribe
- Mute
- Subscribe to RSS Feed
- Permalink
- Report Inappropriate Content
Hi,
Good day to you.
Thanks for posting in Intel® Communities.
Apologies that you are unable to perform profiling on Intel® Xeon® E5-2680 processor.
Intel® VTune™ Profiler uses Hardware Event-Based Sampling (EBS) analysis which makes use of the on-chip Performance Monitoring Unit (PMU). This is only present on 3rd generation Intel® Xeon® processor family v3 (or later) and 4th generation (or later) Intel® Core™ processors.
Refer: Intel® VTune™ Profiler System Requirements: https://www.intel.com/content/www/us/en/developer/tools/oneapi/vtune-profiler.html#twocolumn_1513980175
Intel® Core™ Xeon® E5-2680 being more than ten years old, our developers cannot provide support for the same. We recommend switching to a newer processor to perform any kind of profiling.
Alternatively, if your sole purpose of using Intel® VTune™ Profiler is to profile only the application irrespective of the hardware that you are using, you can use Intel® VTune™ Profiler on Intel® DevCloud for oneAPI. This can you give you valuable insights about the performance of the binary application that you are profiling. Kindly note that if the binary is dependent on the hardware that you are running, you cannot use this method and you might have to recompile it on Intel® DevCloud before performing the analysis.
Intel® VTune™ Profiler on Intel® DevCloud for oneAPI supports the following types of analysis:
- Performance Snapshot
- Hotspots and Threading with user-mode sampling
- Hotspots with HW event-based sampling, HPC Performance Characterization, etc.
- Microarchitecture Exploration
- Memory Access
- Hotspots with HW event-based sampling and call stacks
- Threading with HW event-based sampling
You can sign up for Intel® DevCloud for oneAPI at https://devcloud.intel.com/oneapi/
Refer: Intel® VTune™ Profiling on Intel® DevCloud for oneAPI at https://www.intel.com/content/www/us/en/develop/documentation/vtune-cookbook/top/configuration-recipes/using-vtune-server-with-vs-code-intel-devcloud.html
Hope this helps. If this resolves your issue, kindly accept this as a solution as it might help others with a similar issue.
Thanks and Regards,
Jyothis V James
- Mark as New
- Bookmark
- Subscribe
- Mute
- Subscribe to RSS Feed
- Permalink
- Report Inappropriate Content
Hi,
thanks for Message.
Not the Solution that i need , about few Reasons we can not Chance the complete Developer-Hardware
So i must check for a other Profiler
Thanks and Regards
Franz Bernasek
- Mark as New
- Bookmark
- Subscribe
- Mute
- Subscribe to RSS Feed
- Permalink
- Report Inappropriate Content
Hi,
Good day to you.
We understand that you might have reasons because of which you are currently choosing to go with other profilers for now. Sorry for the inconvenience caused. Please feel free to reach out to us if you need any assistance in using any Intel products or services including VTune in the future.
Since, your initial query has been answered, we won't be monitoring this thread further.
Thanks and Regards,
Jyothis V James
- Mark as New
- Bookmark
- Subscribe
- Mute
- Subscribe to RSS Feed
- Permalink
- Report Inappropriate Content
Hi
now we have Change the CPU to two XEON E5-2690v2 the same problem VTUNE 2023.1 does not detect the CPUs
Now i must find a Visual Profiling Solution on Linux which works with my actual Hardware , same reason exist why we can't change our complete Dell Poweredge Infrastructure.
If i not find a Solution for my Problem, maybe i must remove the oneAPI Toolkits for Linux
Regards
Franz
- Subscribe to RSS Feed
- Mark Topic as New
- Mark Topic as Read
- Float this Topic for Current User
- Bookmark
- Subscribe
- Printer Friendly Page