- Mark as New
- Bookmark
- Subscribe
- Mute
- Subscribe to RSS Feed
- Permalink
- Report Inappropriate Content
We have an optical DNA instrument that generates images. These images are converted to text based molecule data. While the instrument is running we perform quality checks of the data being collected. We may run as many as 6 quality jobs concurrently to keep pace with the instrument. In the last few months we were forced to move from E5-2650v4 processors to 5118 Gold processors due to Intel supply issues. The new processors are so slow our detection process cannot keep pace with the instrument. We used to be able to handle three instruments at the same time. Now we cannot keep pace with one.
We have a test that can reproduce the results and we have captured these results using vtune. The test harness can run a specified number of concurrent quality jobs. To run two concurrent quality jobs it takes the new processors 500ms when the previous E5 chips took only 100ms. We have reproduced these same results on various scalable processors and multiple different chassis from different vendors.
We believe the issue is related to hyper-threads. Each quality job requests all the hyper-threads. The E5 chips seem able to context switch and handle the hyper-thread over subscription, but the scalable chips cannot or at least they show a significant performance hit. We appreciate any input, confirmation, or guidance regarding this issue.
Link Copied
- Mark as New
- Bookmark
- Subscribe
- Mute
- Subscribe to RSS Feed
- Permalink
- Report Inappropriate Content
- Mark as New
- Bookmark
- Subscribe
- Mute
- Subscribe to RSS Feed
- Permalink
- Report Inappropriate Content
Hello,
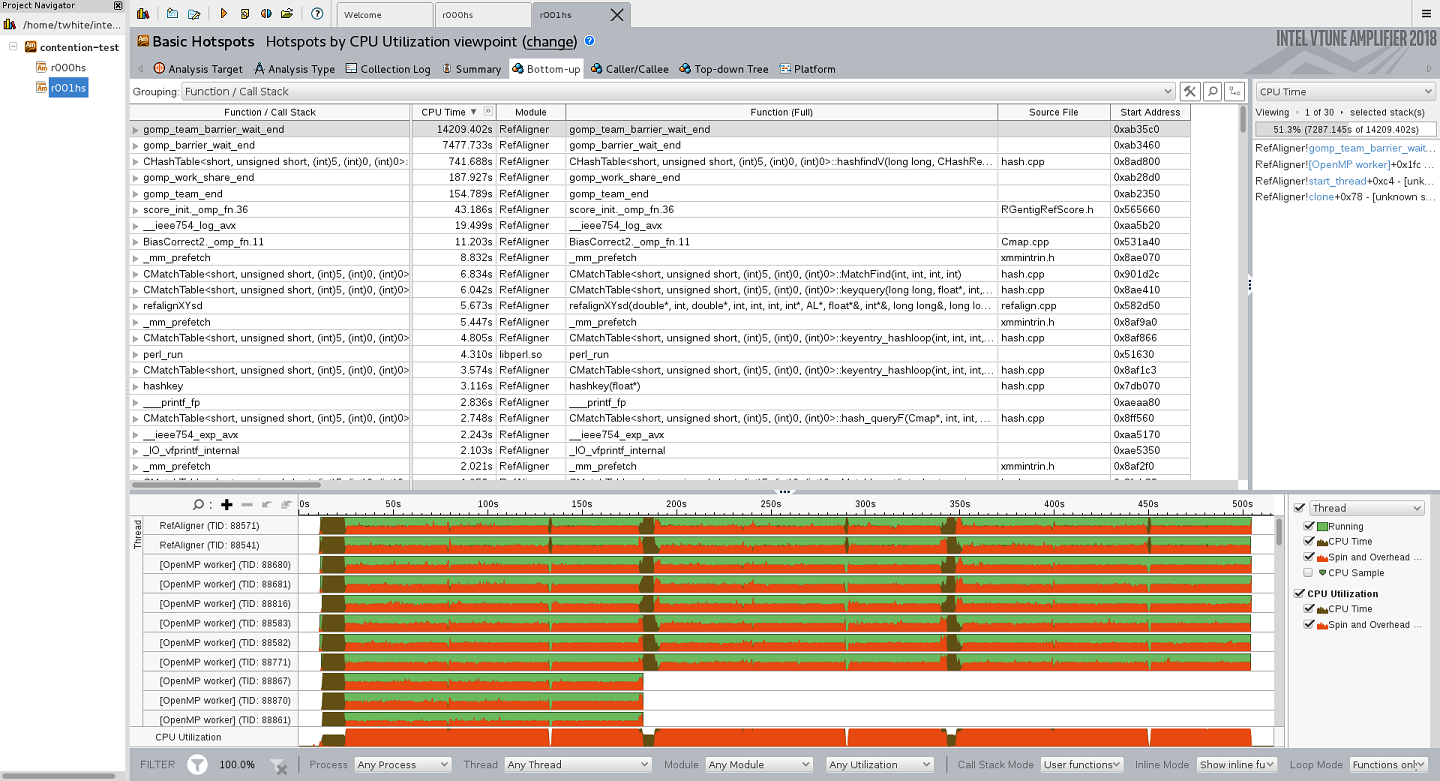
It is difficult to judge looking at the screenshots but it is visible that the intensive parallel work regions (brown on timeline) and the execution time of the most time consuming function CHashTable<... (from grid) are relatively the same.
The major difference in time regions that are actively spinning in worker threads.
Could you please do the following to get more details:
Collect hpc-performance analysis type (it also will have some memory characteristics), sort by CPU Time column, publish the same views for hpc-performance selecting on time line and filtering-in by right mouse button the time regions: for the fast result intensive "red" region from 22sec - 50sec, from the second result correspondent region from 22sec to 180sec.
Also - how many OpenMP threads you use per process?
Thanks & Regards, Dmitry
- Mark as New
- Bookmark
- Subscribe
- Mute
- Subscribe to RSS Feed
- Permalink
- Report Inappropriate Content
Hello,
We identified the issue. We switched from the GCC v5.4 OpenMP library to the Intel OpenMP library and the issue went away. So over-subscribing to the hyper threads, using the v5.4 GCC OpenMP library, and Scalable chips do not work well together. Hope that discover helps other parties out there.
Regards
- Mark as New
- Bookmark
- Subscribe
- Mute
- Subscribe to RSS Feed
- Permalink
- Report Inappropriate Content
Running multiple OpenMP applications sharing the same processors is asking for trouble.... Changes to the OS scheduler or the OpenMP runtime (or the hardware) can turn a tolerable situation into a disaster -- I have seen 500x slowdowns in such cases in the past.....
- Subscribe to RSS Feed
- Mark Topic as New
- Mark Topic as Read
- Float this Topic for Current User
- Bookmark
- Subscribe
- Printer Friendly Page