- Mark as New
- Bookmark
- Subscribe
- Mute
- Subscribe to RSS Feed
- Permalink
- Report Inappropriate Content
Hi,
I am trying to profile a single core application (matrix kindaa 2D operation..).
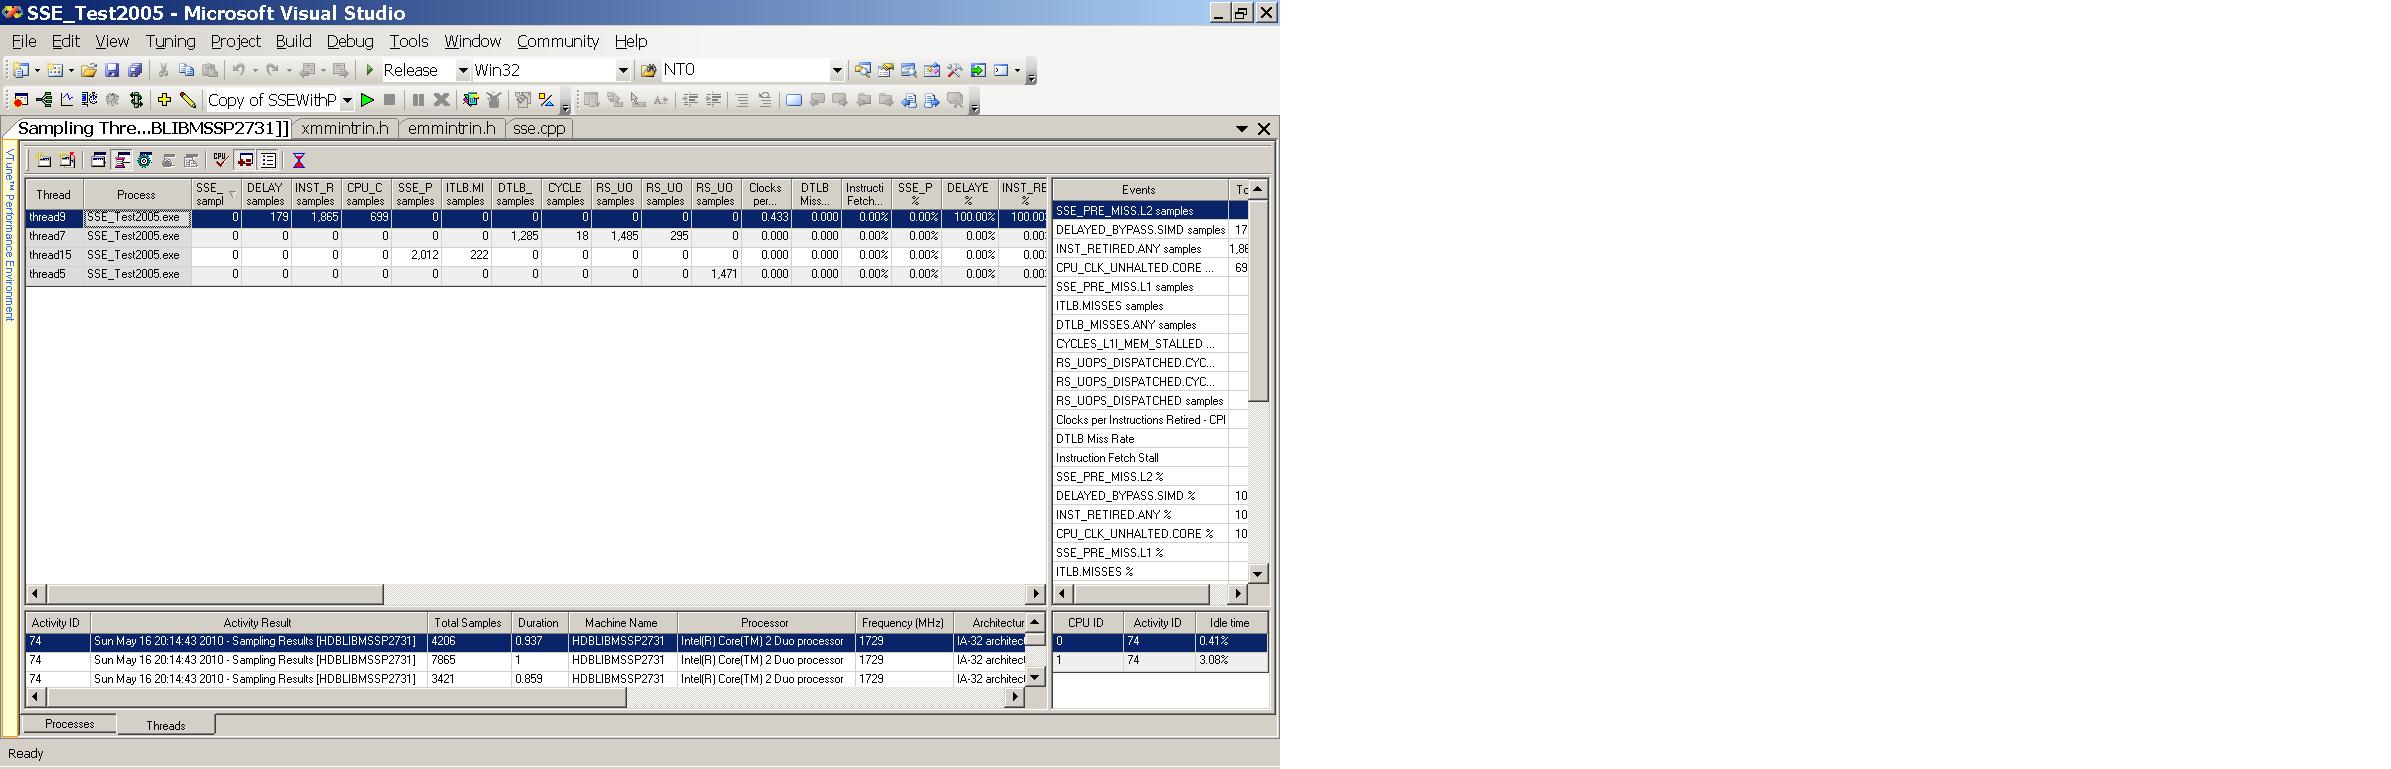
I tried sample profiling with 11 events. When I drill down into my EXE in the sampling results, the window shows 4 threads and data are scaterred between these rows.. Howver, my application is only single-threaded. To reduce confusion, I also nail my main thread to 1 core using the following call:
SetThreadAffinityMask(GetCurrentThread(), 1);
Since the data is scattered in 4 rows now, certain ratios are not coming out clearly. For example: DTLB_MISSES.ANY and INST_RETIRED.ANY are seen in different rows and hence DTLB Miss Rate is 0 in all the 4 rows... I had to divide the data from 2 different rows to make sure that I get the correct rate...
How do I get past this?
Also, what is the "%" of various events shown in the sampling results? They are all 100% always....May be, if I drill down further there would be variations.... Ha.. Possibly...
Thanks for your time,
Best Regards,
Sarnath
- Mark as New
- Bookmark
- Subscribe
- Mute
- Subscribe to RSS Feed
- Permalink
- Report Inappropriate Content
The trick is to skip the thread view. To do this, from the process view, click on the Modules button:

Which will give you the module-level data with the ratios:
Let me know if that helps.
Link Copied
- Mark as New
- Bookmark
- Subscribe
- Mute
- Subscribe to RSS Feed
- Permalink
- Report Inappropriate Content
The trick is to skip the thread view. To do this, from the process view, click on the Modules button:
Which will give you the module-level data with the ratios:
Let me know if that helps.
- Mark as New
- Bookmark
- Subscribe
- Mute
- Subscribe to RSS Feed
- Permalink
- Report Inappropriate Content
This looks like a good idea... I was always wondering how togo-up after I drill-down..... Looks like, "Modules" is the key..... Right?
Is there any other way to drill-upward like a stack(for a lack of better word) after I drill-down..
Thanks! (I was expecting the forum to notify me of replies... I had subscribed to this thread.. Sadly that does not work..)
- Mark as New
- Bookmark
- Subscribe
- Mute
- Subscribe to RSS Feed
- Permalink
- Report Inappropriate Content
To answer your question, though, you may notice the tabs at the bottom of the display. You can use these to jump "back" to where you drilled down from:
- Mark as New
- Bookmark
- Subscribe
- Mute
- Subscribe to RSS Feed
- Permalink
- Report Inappropriate Content
- Subscribe to RSS Feed
- Mark Topic as New
- Mark Topic as Read
- Float this Topic for Current User
- Bookmark
- Subscribe
- Printer Friendly Page