- Mark as New
- Bookmark
- Subscribe
- Mute
- Subscribe to RSS Feed
- Permalink
- Report Inappropriate Content
Hallo,
I worked with the Altera FFT Megafunction.At the output i have an imaginery and a real part. but the output (sourcereal and sourceim)in the simulator is time-dependent. How can i get the frequency-spectrum for the signal? and how can i analyse the output, if its right or wrong?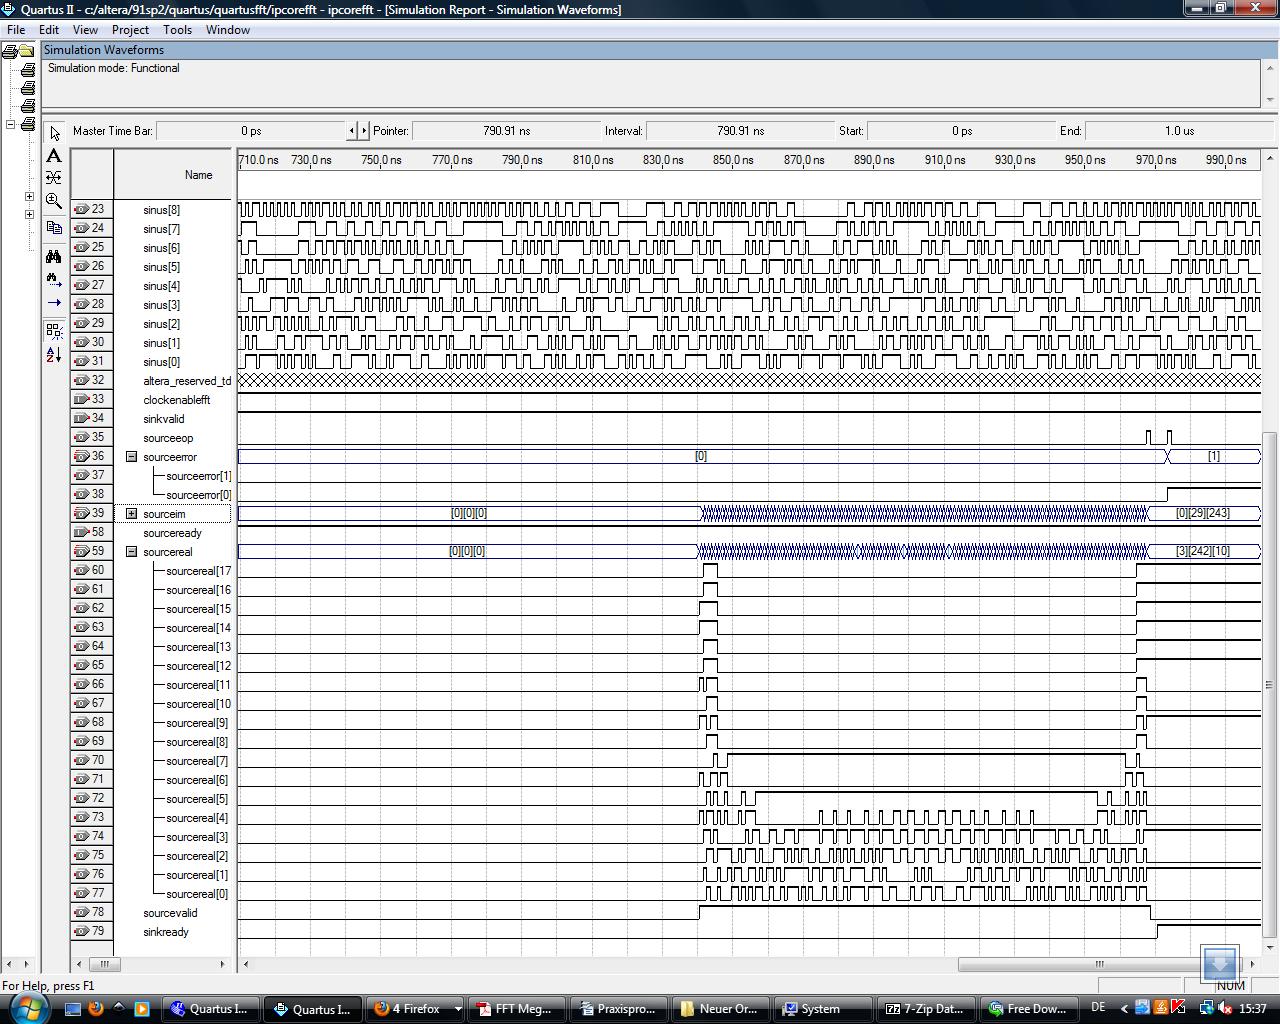
Link Copied
2 Replies
- Mark as New
- Bookmark
- Subscribe
- Mute
- Subscribe to RSS Feed
- Permalink
- Report Inappropriate Content
The I/Q of fft is the frequency domain.
so just plot the absolute value of output. IQ = I + jQ; power = 20* log10(abs(IQ)); %dB f = linspace(-.5*Fs,.5*Fs,fft_points) % if centered on dc else %f = linspace(0,1*Fs,fft_points); %Fs = fft clock frequency plot(f,power)- Mark as New
- Bookmark
- Subscribe
- Mute
- Subscribe to RSS Feed
- Permalink
- Report Inappropriate Content
So If i have a 1024 fft i take the last 1024 values of the real and imaginery part and set them as an array in i and q? What means "centered on dc"?
Reply
Topic Options
- Subscribe to RSS Feed
- Mark Topic as New
- Mark Topic as Read
- Float this Topic for Current User
- Bookmark
- Subscribe
- Printer Friendly Page