Bus Analyzer Toolkit
Success! Subscription added.
Success! Subscription removed.
Sorry, you must verify to complete this action. Please click the verification link in your email. You may re-send via your profile.
Bus Analyzer Toolkit
- Subscribe to RSS Feed
- Mark as New
- Mark as Read
- Bookmark
- Subscribe
- Printer Friendly Page
- Report Inappropriate Content
Bus Analyzer Toolkit
Gain visibility into your Qsys interconnect based system
- Monitor performance in real-time using throughput metrics
- read transfers
- write transfers
- Supports Avalon-MM interface
- minimum required setup - 3 components
- example - 1 master, 2 slaves
- example - 2 masters, 1 slave
- maximum tested limit - 15 components
- example - 3 masters, 12 slaves
- You can use all devices that Quartus II v13.1 software supports
- Instrument metrics using the Qsys GUI
Instrumentation procedure
- Open Qsys
- Create Avalon-MM system in Qsys
- Add Debug Host Link component to design (instantiate JTAG Debug Link or USB Debug Link)
- Open Instrumentation Panel
- Select "Add debug instrumentation to the Qsys interconnect"
- Add performance monitors to interfaces
- Generate Qsys system
- Compile design
- Program FPGA
- Open Bus Analyzer Toolkit from Quartus II software main menu
- Run Bus Analyzer Toolkit
- Select device (if needed)
- Click Run
- Source Tcl script
NOTE: In v14.1 and later, the JTAG Debug Link is auto-instantiated and is not a selectable IP core from the IP Catalog.
Steps for Qsys GUI
Open Bus Analyzer from Quartus II main menu
Using the Bus Analyzer Toolkit
Quick Tips
- Zoom Feature
- Place mouse cursor on a graph
- click left mouse button to zoom in
- click right mouse button to zoom out
- Optional, use scroll wheel to zoom
- Right-click menu
- Use mouse to right-click on the statistics panel
- Show long names - shows hierarchy
- Select visible metrics - selects read transfer and/or write transfer to display in statistics panel
- Set averaging window size - select sample count
- Export data - saves raw data as a .csv file
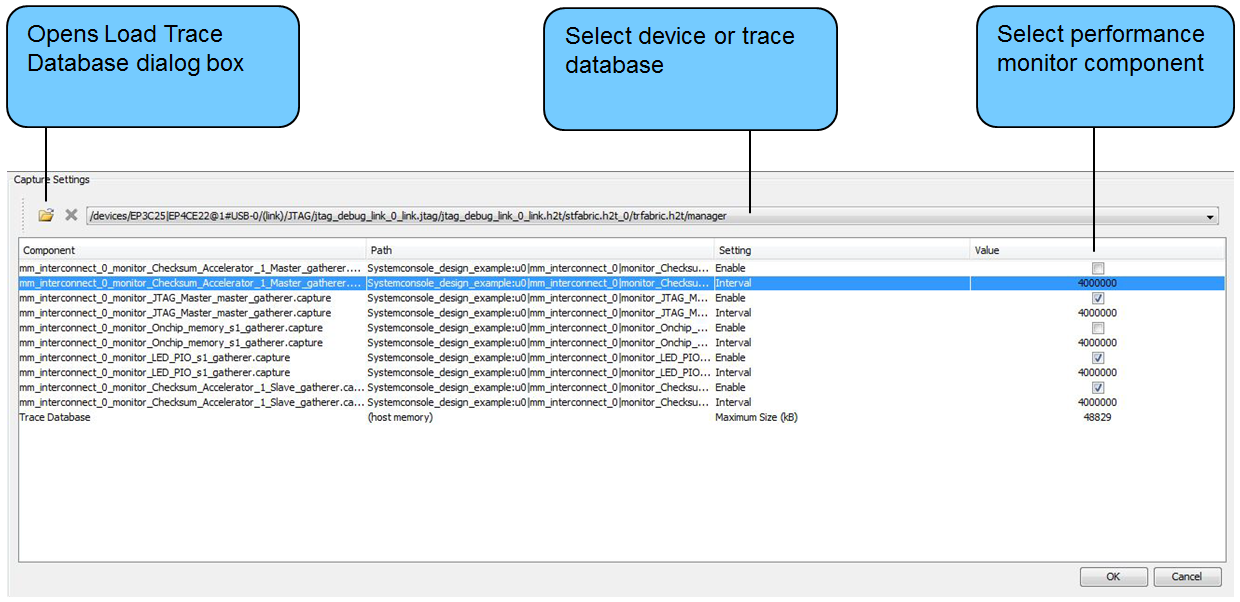
Capture Settings Window
Load Trace Database dialog box
Limitations
- You can uncheck "Add debug instrumentation to the Qsys interconnect" to save your current instrumentation setup. You must re-generate and re-compile your design when you select this checkbox and turn on your saved instrumentation setup.
- When not in use, turning off your instrumentation setup saves system resources.
- When you make changes to your instrumentation setup, you must re-generate and re-compile your design.
- example: Adding or removing a master or slave component from your Qsys system.
- example: Adding or removing a performance monitor from the Instrumentation Panel.
- example: Turning off and turning back on your current instrumentation setup.
Reference information
- Read Transfer - per unit interval of time
- When monitoring a master, you can see how many data reads per second that this master achieves from all its slaves.
- When monitoring a slave, you can see how many data reads per second that this slave is delivering to all its masters.
- Write Transfer - per unit interval of time
- When monitoring a master, you can see how many data writes per second that this master can get write commands into the fabric.
- When monitoring a slave, you can see how many data writes per second that this slave can accept write commands from all its masters.
Feedback
Bus Analyzer Toolkit (Beta) - Feedback
We are actively planning work on the Bus Analyzer Toolkit to be released in a future version of Quartus II software. To that end, we would like to prioritize the work we do. Could you answer the following:
- What would you like to see in future versions of the Bus Analyzer Toolkit?
- What metrics would you like to track?
- Please describe the system you would use the Bus Analyzer Toolkit for?
- Is the size of the instrumentation modules a concern for you (or how large is too large)?
- Do you need to tap AXI or other buses?
Community support is provided during standard business hours (Monday to Friday 7AM - 5PM PST). Other contact methods are available here.
Intel does not verify all solutions, including but not limited to any file transfers that may appear in this community. Accordingly, Intel disclaims all express and implied warranties, including without limitation, the implied warranties of merchantability, fitness for a particular purpose, and non-infringement, as well as any warranty arising from course of performance, course of dealing, or usage in trade.
For more complete information about compiler optimizations, see our Optimization Notice.