- Mark as New
- Bookmark
- Subscribe
- Mute
- Subscribe to RSS Feed
- Permalink
- Report Inappropriate Content
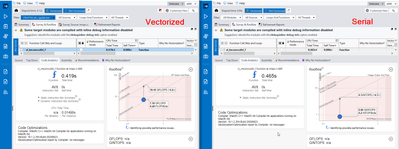
I have vectorized part of my application manually using intrinsic and I am trying to compare the two version's roofline analysis. However, I see GFLOPS being reported for one and GINTOPS for the other.
I am wondering how I can see both values (possibly in the chart). Please let me know if there is any way to see both values.
Many thanks,
Link Copied
- Mark as New
- Bookmark
- Subscribe
- Mute
- Subscribe to RSS Feed
- Permalink
- Report Inappropriate Content
Hi,
Thank you for reaching out. We have raised this query with the internal team. We will get back to you as soon as we get an update.
Regards
Gopika
- Mark as New
- Bookmark
- Subscribe
- Mute
- Subscribe to RSS Feed
- Permalink
- Report Inappropriate Content
Hello!
This small Roofline plot is always built for a dominating data type of the selected loop. It means GFLOP count dominates over GINTOP count for the selected row. Probably the balance between FLOP/INTOP has changed after making some changes in the code.
You can choose FLOAT/INT on the big Roofline chart and see your loop/function roofline position. To view big Roofline chart, please press Roofline at blue vertical menu near the Survey table. To switch Roofline configuration from INT to FLOAT, use menu at Roofline view (see attached screenshot)
Thank you for providing the feedback. Will a switcher between float/int in Code Analytics be helpful in your case?
- Mark as New
- Bookmark
- Subscribe
- Mute
- Subscribe to RSS Feed
- Permalink
- Report Inappropriate Content
Hi,
We have not heard from you in a while. Did the solution provided by Ekaterina helped? Is your query resolved? If yes, can we discontinue monitoring this thread?
Regards
Gopika
- Mark as New
- Bookmark
- Subscribe
- Mute
- Subscribe to RSS Feed
- Permalink
- Report Inappropriate Content
Hi,
We have not heard from you in a while. If you need any additional information, please submit a new question as this thread will no longer be monitored.
Regards
Gopika
- Subscribe to RSS Feed
- Mark Topic as New
- Mark Topic as Read
- Float this Topic for Current User
- Bookmark
- Subscribe
- Printer Friendly Page
