- Mark as New
- Bookmark
- Subscribe
- Mute
- Subscribe to RSS Feed
- Permalink
- Report Inappropriate Content
Hello Intel Compiler Team,
I face following issue (intel compiler 2013, Visual Studio 10):
I added /traceback compilation option (release mode), but when I run the program from a windows console (my OS is windows 7), A microsoft error window opens, and I do not get the traceback in the console.
Known issue? Or did I miss a compilation option?
KR
Gael.
Link Copied
- Mark as New
- Bookmark
- Subscribe
- Mute
- Subscribe to RSS Feed
- Permalink
- Report Inappropriate Content
Hello Intel Compiler Team,
I add following info:
- My VS10-intel13 compiler project is a dll called by a client.
- I set /traceback for both: the dll and the client.
- the dll is C++ code.
- When the client is C/C++, I do not get the trace in windows console (I just get a microsoft error window).
- when the client is Fortran, I do get a reasonable trace but not fully exact and complete: some function calls are missing in the trace, and line pointed is not fully exact sometimes.
Main issue currently is : the absence of trace if the client is C/C++. Any specific set of compilation option to be defined?
Kind regards,
Gael.
- Mark as New
- Bookmark
- Subscribe
- Mute
- Subscribe to RSS Feed
- Permalink
- Report Inappropriate Content
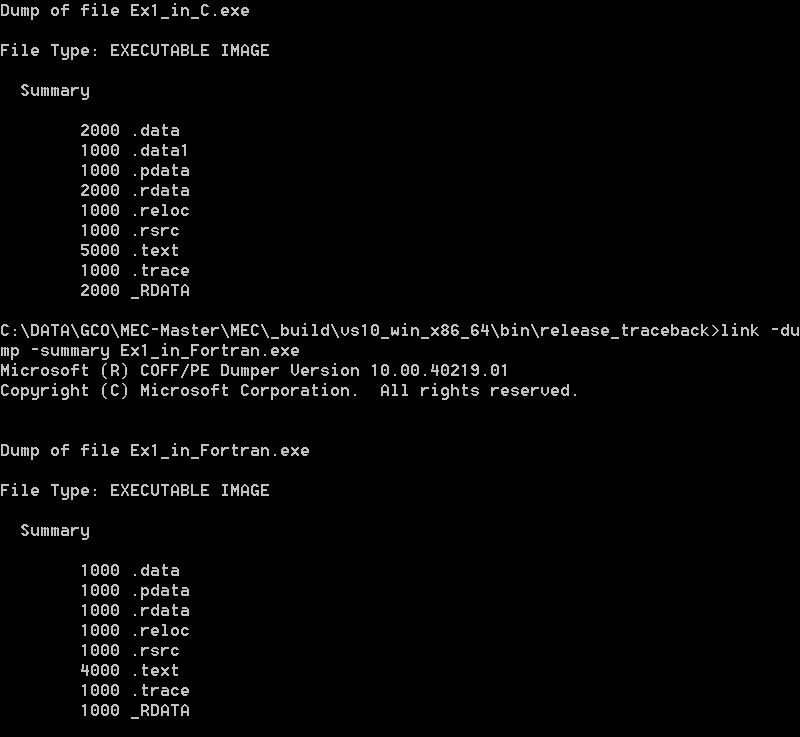
Check whether the EXE that you built has traceback information, by using the command
link -dump -summary <your_app_name.exe>
If the output does not show a ".trace" section, you have to look at the build process to spot any source files that may have been compiled without traceback information. Even if there are no such sources, if your EXE uses routines from a library that was built without the traceback option, you will see no line-number information for those routines.
- Mark as New
- Bookmark
- Subscribe
- Mute
- Subscribe to RSS Feed
- Permalink
- Report Inappropriate Content
Looks like this "link" is not part of intel 13 compiler distribution for windows.
How can I get that executable?
KR
Gael
- Mark as New
- Bookmark
- Subscribe
- Mute
- Subscribe to RSS Feed
- Permalink
- Report Inappropriate Content
LINK and a few other utils are essential for any program development on Windows. You certainly have Link installed as part of a Windows SDK or as part of Visual Studio. Without it, you would have been unable to build and run any C or Fortran program using the Intel compilers. What you probably tried is to run Link from a plain CMD window, in which the path to Link would not have been included in %PATH%.
Open a command window for use with Intel C or with MS Visual C, and you will find yourself able to run Link from that window.
- Mark as New
- Bookmark
- Subscribe
- Mute
- Subscribe to RSS Feed
- Permalink
- Report Inappropriate Content
- Mark as New
- Bookmark
- Subscribe
- Mute
- Subscribe to RSS Feed
- Permalink
- Report Inappropriate Content
Hi, Gael
The traceback option tells the compiler to generate extra information in the object file to provide source file traceback information when a severe error occurs at run time. This is intended for use with C code that is to be linked into a Fortran program.
That's to say this is only supported by Intel Fortran Runtime, not the C runtime from Microsoft Windows.
Hope this explains.
Thanks.
- Mark as New
- Bookmark
- Subscribe
- Mute
- Subscribe to RSS Feed
- Permalink
- Report Inappropriate Content
Thanks!
That is clear now,
KR
Gael
- Subscribe to RSS Feed
- Mark Topic as New
- Mark Topic as Read
- Float this Topic for Current User
- Bookmark
- Subscribe
- Printer Friendly Page