- Mark as New
- Bookmark
- Subscribe
- Mute
- Subscribe to RSS Feed
- Permalink
- Report Inappropriate Content
Dear Support Team,
I am testing gpu-hotspots on DevCloud following the article here:
I was able to reproduce the result with Gen9 queue. For Iris Xe Max queue, which contains 2 and 4 GPUs respectively, the 'Trace GPU programming APIs' does not support multiple GPU adapters'. Please see the attached file.
So my questions are as follows
1. How can I select only one Xe GPU for hotpot analysis ?
2. In the 'Analyze Multiple GPUs' section here:
Quote: "You can also find this information on your Windows (see Task Manager) or Linux (run
- Mark as New
- Bookmark
- Subscribe
- Mute
- Subscribe to RSS Feed
- Permalink
- Report Inappropriate Content
Hi,
Sorry for the delay , You can select only one Xe GPU for hotspot analysis.
Please find the below two methods to run the analysis.
Method- 1: (using webserver: https://www.intel.com/content/www/us/en/develop/documentation/vtune-cookbook/top/configuration-recipes/using-vtune-server-with-vs-code-intel-devcloud.html )
1) Log into the DevCloud login node:
ssh devcloud
2) Enter into compute node:
qsub -I -l nodes=1:quad_gpu:ppn=2
note: Do not close the terminal after this step, as the action will release your compute node.
3) Open a new terminal.
ssh -L 127.0.0.1:55001:127.0.0.1:55001 devcloud
4)Establish an SSH connection from the login node to the compute node with one more SSH tunnel:
ssh -L 127.0.0.1:55001:127.0.0.1:55001 s000-n000
note: Replace s000-n000 with your compute node name.
vtune-backend --web-port=55001 --enable-server-profiling
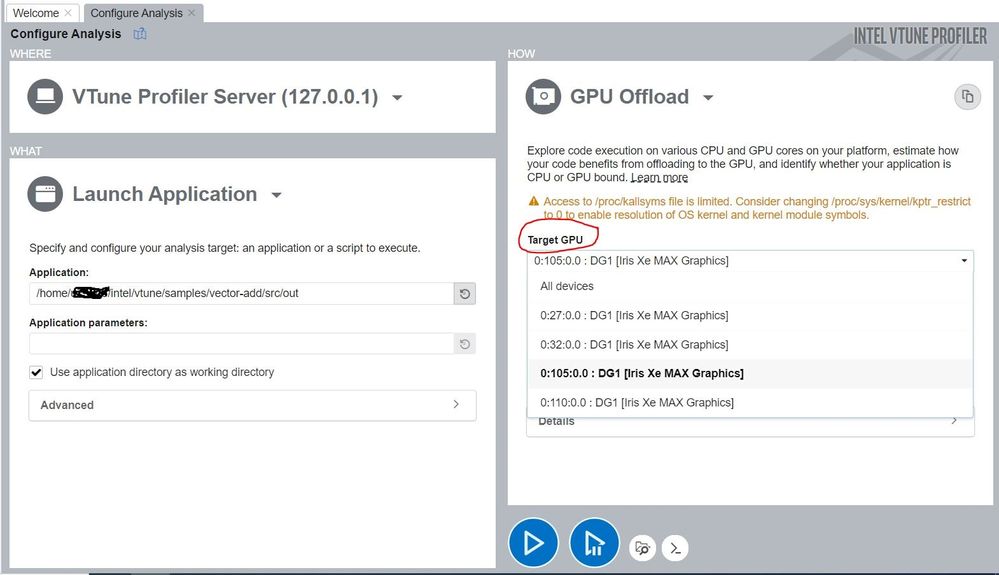
Now you can use vtune on webserver and there you can see target GPU dropdown(you can see in attached image), By
clicking on HOW(right side top icon) we can select analysis type.
Method- 2: (using command line)
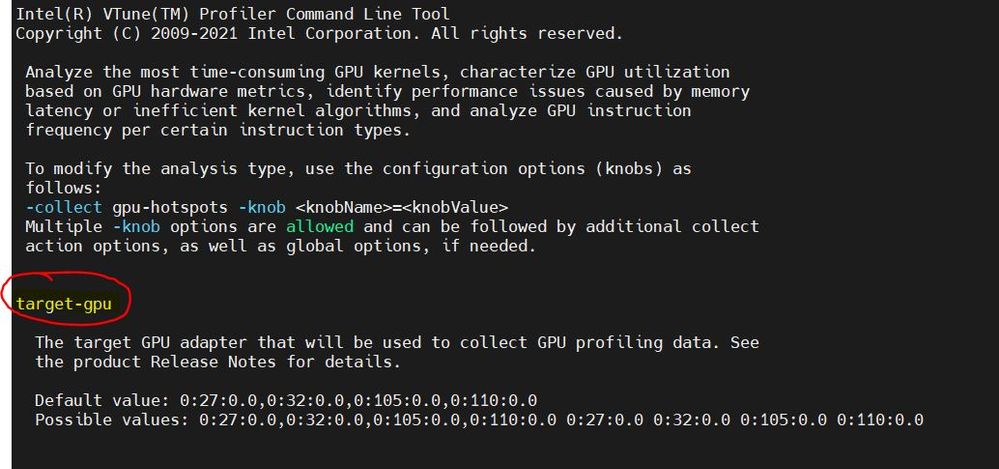
1)Type the below command to view available GPUs:
vtune -help collect gpu-hotspots
There you can see target-gpu, <domain:bus:device.function>(example:0:27:0.0) with this id you can select
desired GPU
2)With that id now you can run your analysis:
vtune -collect gpu-offload -knob target-gpu=0:27:0.0 /<Path to the executable>
About -knob parameter please refer below documentation:
Thanks,
Jaideep
Link Copied
- Mark as New
- Bookmark
- Subscribe
- Mute
- Subscribe to RSS Feed
- Permalink
- Report Inappropriate Content
I attached here the text output of vtune:
Elapsed Time: 5.211s
    GPU Time: 0.009s
0:27:0.0 : DG1 [Iris Xe MAX Graphics]
    GPU Tile 0
        EU Array Stalled/Idle: 100.0%
         | The percentage of time when the EUs were stalled or idle is high,
         | which has a negative impact on compute-bound applications.
         |
            Occupancy: 0.0%
             | Several factors including shared local memory, use of memory
             | barriers, and inefficient work scheduling can cause a low value
             | of the occupancy metric.
             |

                Hottest GPU Computing Tasks with Low Occupancy
                Computing Task         Total Time  Global Size  Local Size  SIMD Width  Occupancy(%)  SIMD Utilization(%)
                ---------------------  ----------  -----------  ----------  ----------  ------------  -------------------
                _ZTSZ4mainEUlT_E54_37      0.297s  2048 x 2048     512 x 1          32          0.0%               100.0%
            Sampler Busy: 0.0%

                Hottest GPU Computing Tasks with High Sampler Usage
                Computing Task  Total Time
                --------------  ----------
            DRAM Bandwidth Bound: 0.0%

                Hottest GPU Computing Tasks Bound by DRAM Bandwidth
                Computing Task  Total Time
                --------------  ----------
0:32:0.0 : DG1 [Iris Xe MAX Graphics]
    GPU Tile 0
        EU Array Stalled/Idle: 100.0%
         | The percentage of time when the EUs were stalled or idle is high,
         | which has a negative impact on compute-bound applications.
         |
            Occupancy: 0.0%
             | Several factors including shared local memory, use of memory
             | barriers, and inefficient work scheduling can cause a low value
             | of the occupancy metric.
             |

                Hottest GPU Computing Tasks with Low Occupancy
                Computing Task  Total Time  Global Size  Local Size  SIMD Width  Occupancy(%)  SIMD Utilization(%)
                --------------  ----------  -----------  ----------  ----------  ------------  -------------------
            Sampler Busy: 0.0%

                Hottest GPU Computing Tasks with High Sampler Usage
                Computing Task  Total Time
                --------------  ----------
            DRAM Bandwidth Bound: 0.0%

                Hottest GPU Computing Tasks Bound by DRAM Bandwidth
                Computing Task  Total Time
                --------------  ----------
I guess '0:27:0.0' and '0:32:0.0' are the PCIe designation for Xe GPUs. It seems that the first one is selected, yet 'EU array stalled is 100%', i.e GPU is not used at all. Open the result with vtune-gui shows the error message in my opening post.
So unless there is way to select only one Xe GPU, it may not possible to view result with vtune-gui
- Mark as New
- Bookmark
- Subscribe
- Mute
- Subscribe to RSS Feed
- Permalink
- Report Inappropriate Content
Hi,
Thank you for posting in Intel Communities.
We are investigating your issue at our end, Could you please share the VTune version for better understanding.
Thanks,
Jaideep
- Mark as New
- Bookmark
- Subscribe
- Mute
- Subscribe to RSS Feed
- Permalink
- Report Inappropriate Content
Dear Jaideep
Sorry for late follow up. Thanks for taking a look at this problem.
On DevCloud, it is the 2021.7.1 version. Since DevCloud does not support X11 forwarding, I installed 2021.8.0 version locally.
I couldn't find 7.1 version, since the download page always offer the latest one.
Nevertheless, I could still load gen9 results as mentioned in the original post. So I think version is not a concern here.
From the help message of 'collect':
$ vtune -help collect gpu-hotspots
...
collect-programming-api

  Analyze DPC++, OpenCL, and Intel Media SDK programs running on Intel
  Processor Graphics. This option may affect the performance of your
  application on the CPU side.

  Default value: true
  Possible values: true false
For multiple GPUs, this option is disabled as shown in the error message. Thus:
- I can run SYCL codes without issue and obtain correct results.
- I can still profile SYCL codes, but the results are defaulted to '0.0%' as shown in 2nd post.
- I cannot load the multi-GPU results into VTune.
Since I don't have Iris card on my side, I could not check whether VTune will work with a single-tile card.
I hope this helps your investigation.
Regards.
- Mark as New
- Bookmark
- Subscribe
- Mute
- Subscribe to RSS Feed
- Permalink
- Report Inappropriate Content
Hi,
Sorry for the delay , You can select only one Xe GPU for hotspot analysis.
Please find the below two methods to run the analysis.
Method- 1: (using webserver: https://www.intel.com/content/www/us/en/develop/documentation/vtune-cookbook/top/configuration-recipes/using-vtune-server-with-vs-code-intel-devcloud.html )
1) Log into the DevCloud login node:
ssh devcloud
2) Enter into compute node:
qsub -I -l nodes=1:quad_gpu:ppn=2
note: Do not close the terminal after this step, as the action will release your compute node.
3) Open a new terminal.
ssh -L 127.0.0.1:55001:127.0.0.1:55001 devcloud
4)Establish an SSH connection from the login node to the compute node with one more SSH tunnel:
ssh -L 127.0.0.1:55001:127.0.0.1:55001 s000-n000
note: Replace s000-n000 with your compute node name.
vtune-backend --web-port=55001 --enable-server-profiling
Now you can use vtune on webserver and there you can see target GPU dropdown(you can see in attached image), By
clicking on HOW(right side top icon) we can select analysis type.
Method- 2: (using command line)
1)Type the below command to view available GPUs:
vtune -help collect gpu-hotspots
There you can see target-gpu, <domain:bus:device.function>(example:0:27:0.0) with this id you can select
desired GPU
2)With that id now you can run your analysis:
vtune -collect gpu-offload -knob target-gpu=0:27:0.0 /<Path to the executable>
About -knob parameter please refer below documentation:
Thanks,
Jaideep
- Mark as New
- Bookmark
- Subscribe
- Mute
- Subscribe to RSS Feed
- Permalink
- Report Inappropriate Content
Hi again Jaideep,
Thanks for the detailed answers.
I thought the id listed in the help message were just examples, and not the real IDs of the Xe GPUs.
I've tried both methods and now obtained the results.
For purpose of refrence, I include the result below
0:27:0.0 : DG1 [Iris Xe MAX Graphics]
    GPU Tile 0
        EU Array Stalled/Idle: 77.9%
         | The percentage of time when the EUs were stalled or idle is high,
         | which has a negative impact on compute-bound applications.
         |
            GPU L3 Bandwidth Bound: 43.0%

                Hottest GPU Computing Tasks Bound by GPU L3 Bandwidth
                Computing Task  Total Time
                --------------  ----------
            Occupancy: 98.8%

                Hottest GPU Computing Tasks with Low Occupancy
                Computing Task  Total Time  Global Size  Local Size  SIMD Width  Occupancy(%)  SIMD Utilization(%)
-------------- ---------- ----------- ---------- ---------- ------------ -------------------- EU Stalled/L3 Bound/Occupancy show that Xe GPU has actual workload.
- I can transfer the result to my local machine and open it with vtune-gui 21.8.0. Everything can be viewed except the memory hierarchy, probably due to difference between devcloud's and local's version.
I will mark this question solved. Once again, thanks very much for your time.
Regards.
- Mark as New
- Bookmark
- Subscribe
- Mute
- Subscribe to RSS Feed
- Permalink
- Report Inappropriate Content
Hi Viet-Duc,
Thanks for accepting our solution. If you need any additional information, please post a new question as this thread will no longer be monitored by Intel.
Thanks,
Jaideep
- Subscribe to RSS Feed
- Mark Topic as New
- Mark Topic as Read
- Float this Topic for Current User
- Bookmark
- Subscribe
- Printer Friendly Page

