- Mark as New
- Bookmark
- Subscribe
- Mute
- Subscribe to RSS Feed
- Permalink
- Report Inappropriate Content
Say I have 3 modules:
Link Copied
- Mark as New
- Bookmark
- Subscribe
- Mute
- Subscribe to RSS Feed
- Permalink
- Report Inappropriate Content
Do you have registers on the boundaries of your partitions? If you don't, then paths in the top level may become critical. Remember that there is no optimization across partition boundaries, so combinational logic on the boundaries of the design partitions cannot be optimized with respect to the top level.
Adding registers at the boundaries can fix this, allowing you to run the design faster at the expense of an extra cycle of latency.
#iwork4intel
- Mark as New
- Bookmark
- Subscribe
- Mute
- Subscribe to RSS Feed
- Permalink
- Report Inappropriate Content
So before sending a signal to a other module , I am registering it .
- Mark as New
- Bookmark
- Subscribe
- Mute
- Subscribe to RSS Feed
- Permalink
- Report Inappropriate Content
Hi,
Is the failing path within the sub-modules? Have you tried to preserve timing-closed partitions and use in the top design?
Thanks.
Best regards,
KhaiY
- Mark as New
- Bookmark
- Subscribe
- Mute
- Subscribe to RSS Feed
- Permalink
- Report Inappropriate Content
1) if I don't preserve design partition (fitter netlist of a submodule ) then yes , there are some failing paths within the submodule. Few days back fitter used to fail because of high routing congestion . So, I changed the fitter effort to 8.0 , so fitter passes but with significant loss of timing .
2) If I preserve design partition(fitter netlist of the submodule ), then I don't think I have any critical paths within sub-modules . But there is inbetween 2 sub-modules. Here I get this fitter error sometimes :
Error (18999): Placement cannot find a legal solution.
Error (170079): Cannot place node <name>of type MLAB cell.
But after changing fitter effort settings to 8.0 . It will pass with loss in timing.
3)what does preserve timing closed partition mean ? Is it same as preserving fitter netlist in design partition? If yes , then yes I have done as in 2nd point
- Mark as New
- Bookmark
- Subscribe
- Mute
- Subscribe to RSS Feed
- Permalink
- Report Inappropriate Content
Hi,
What is your interconnect usage? Designs with an average value below 50% typically do not have any problems with routing. Designs with an average between 50-65% may have difficulty routing. Designs with an average over 65% typically have difficulty meeting timing unless the RTL tolerates a highly utilized chip. Peak values at or above 90% are likely to have problems with timing closure; a 100% peak value indicates that all routing in an area of the device has been used, so there is a high possibility of degradation in timing performance.
Thanks.
Best regards,
KhaiY
- Mark as New
- Bookmark
- Subscribe
- Mute
- Subscribe to RSS Feed
- Permalink
- Report Inappropriate Content
find the interconnect usage as below:
Average interconnect usage (total/H/V) 50.7% / 48.7% / 57.0%
Peak interconnect usage (total/H/V) 80.4% / 81.7% / 86.1%
- Mark as New
- Bookmark
- Subscribe
- Mute
- Subscribe to RSS Feed
- Permalink
- Report Inappropriate Content
Average interconnect usage (total/H/V) 50.7% / 48.7% / 57.0%
Peak interconnect usage (total/H/V) 80.4% / 81.7% / 86.1%
Since average interconnect is less it should not cause any problems in routing right ?
But 8 out of 10 times fitter terminates because of routing congestion.
Is there a way to find which module has high interconnect usage ? So that I can change the coding style and improve timing .
- Mark as New
- Bookmark
- Subscribe
- Mute
- Subscribe to RSS Feed
- Permalink
- Report Inappropriate Content
Hi Yogesh,
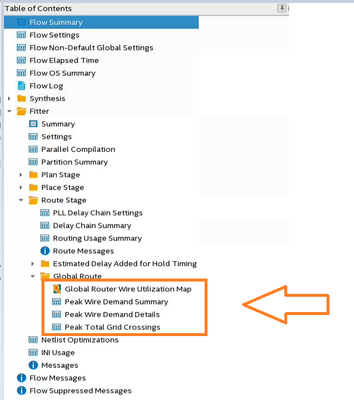
Yes. There is a way to check which module uses most of the routing resources.
Thanks.
Best regards,
KhaiY
- Mark as New
- Bookmark
- Subscribe
- Mute
- Subscribe to RSS Feed
- Permalink
- Report Inappropriate Content
Hi Khai,
I think the screenshot you shared is for quartus pro edition. I am using intel quartus standard edition 18.1
I find only routing usage summary under logic and routing section ,which only talks about resources like Block interconnects
C12 interconnects
C2 interconnects
C4 interconnects
and not about module level usage . Is there someother option to check the same w.r.t each module of my project?
thankyou
regards,
Yogesh
- Mark as New
- Bookmark
- Subscribe
- Mute
- Subscribe to RSS Feed
- Permalink
- Report Inappropriate Content
Hi Yogesh,
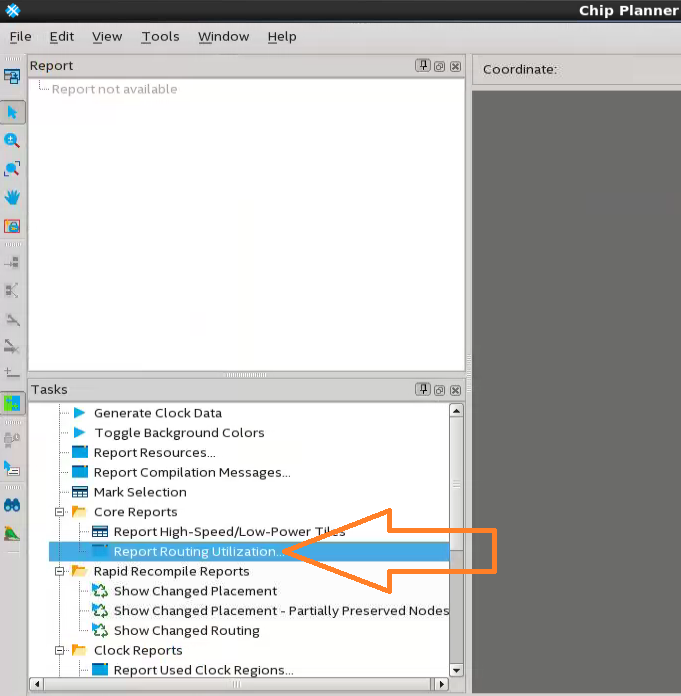
The report in the Pro edition is different from the Standard edition. In this case, you have to check the routing utilization in the Chip Planner.
Thanks.
Best regards,
KhaiY
- Mark as New
- Bookmark
- Subscribe
- Mute
- Subscribe to RSS Feed
- Permalink
- Report Inappropriate Content
Hi,
We do not receive any response from you to the previous question/reply/answer that I have provided. This thread will be transitioned to community support. If you have a new question, feel free to open a new thread to get the support from Intel experts. Otherwise, the community users will continue to help you on this thread. Thank you
Best regards,
KhaiY
- Subscribe to RSS Feed
- Mark Topic as New
- Mark Topic as Read
- Float this Topic for Current User
- Bookmark
- Subscribe
- Printer Friendly Page

