- Mark as New
- Bookmark
- Subscribe
- Mute
- Subscribe to RSS Feed
- Permalink
- Report Inappropriate Content
This is an issue with VS2013 shell, not VS2010.
We were required to go to this later shell to support newer releases of Fortran, like 17.0
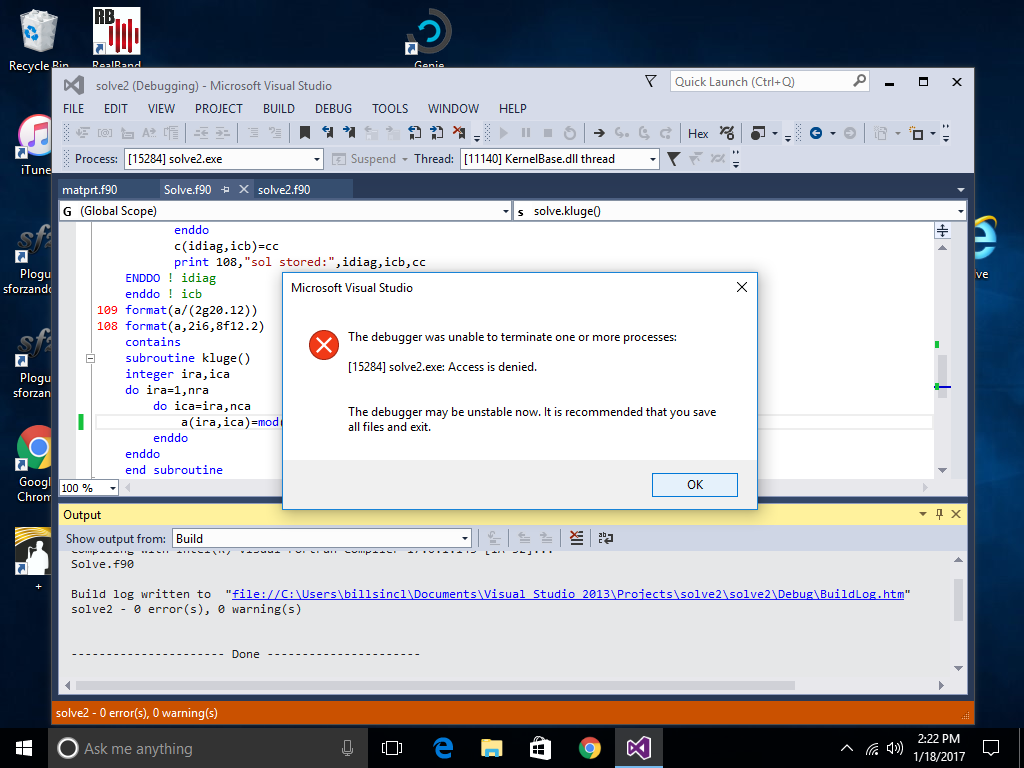
WHAT SOMETIMES HAPPENS IS THE DEBUGGER IS DOING SOME STUFF IN LA-LA-LAND
after a debugging session. And then when I say "stop" or "restart" I get the "blue circle of death."
Meaning that it crashes after 30 seconds or so, and then I cant do another build, compile or anything else.
I get a message that says "debugger may be unstable." The only way to get back into my project is
to exit from VS2013 and start over.
Now the hangup can sometimes be avoided if when I close the output window I say CONTINUE from the breakpoint, and that stops the debugger.
As you probably know, closing the output window does generate a breakpoint. But if that is not handled properly, the debugger is still
wandering around in La-la land, and that's where the trouble is.
Unfortunately no one takes this seriously, because they say they "cannot duplicate the problem on their system."
So I cant get any help from someone that wants to take a serious look at this issue. Are they just being lazy ?
Their is nothing unusual about my setup, since I am using the most up-to-date INTEL CPU and Windows 10.
Has anyone else seen this issue ?
Link Copied
- Mark as New
- Bookmark
- Subscribe
- Mute
- Subscribe to RSS Feed
- Permalink
- Report Inappropriate Content
Hello,
It seems you have talked to someone at Intel already. If so, could you please provide me the Intel Premier Support ticket #? I'll follow up with the ticket owner and an engineer of the Fortran debugger extension (FEE).
Given your description so far, I might warn you upfront that cases like that are not easy to reproduce. So, I'll have more questions to you later and I hope you help me. But first, I'll look at the ticket and the previous communication once you provide me the #.
Best regards,
Georg Zitzlsberger
- Mark as New
- Bookmark
- Subscribe
- Mute
- Subscribe to RSS Feed
- Permalink
- Report Inappropriate Content
Well, the conversation was with Kevin D Davis of Intel. I could not find the support ticket number right away.
He kept wanting to duplicate the problem on his setup, but that would be totally non-relevant.
As was said earlier, there is a problem in my environment, but there is nothing unusual about what I have here.
Furthermore, the VS 2010 does not do the same thing. So Microsoft introduced a BUG in VS2013 that should be looked at.
More and more users are going to try to go to the newer CPU and operating system I have, so we are going to see this a lot more often.
Doesn't Microsoft take any responsibility with what they gave us ? This keeps me from wanting to upgrade my Fortran, since I would then be stuck with VS2013. I cannot use the new Fortran with VS2010.
A team viewer session would be the best way to show you the problem.
- Mark as New
- Bookmark
- Subscribe
- Mute
- Subscribe to RSS Feed
- Permalink
- Report Inappropriate Content
- Mark as New
- Bookmark
- Subscribe
- Mute
- Subscribe to RSS Feed
- Permalink
- Report Inappropriate Content
Does Microsoft take any involvement with what they gave us ?
Are they accountable ? I guess we are stuck with this **** ?
- Mark as New
- Bookmark
- Subscribe
- Mute
- Subscribe to RSS Feed
- Permalink
- Report Inappropriate Content
Hello,
let's try to find out whether FEE is responsible for the problem you describe. FEE is the only component from the Intel Parallel Studio XE suite that's affecting (i.e. extending) the VS debugger. If the following files are renamed, FEE will be deactivated:
C:\Program Files (x86)\Microsoft Visual Studio 12.0\Common7\Packages\Debugger
- FEE.dll
- FEE.vsdconfig
- ForIntrinsics.dll
- ForIntrinsics.vsdconfig
- ForOps11.dll
C:\Program Files (x86)\Microsoft Visual Studio 12.0\Common7\IDE\Remote Debugger\x64
- ForIntrinsics.dll
- ForOps11.dll
Please rename those files to *.dll_dontuse while VS IDE is not running. Start VS 2013 IDE after that and FEE won't be activated (watches in the debugger window won't have Fortran types, for example).
You can still start debug sessions but Fortran syntax/expressions won't be recognized by the underlying VS debugger (only C/C++). If you start seeing the same problem with FEE disabled, it's a general VS debugger concern. We won't be able to help you further and you better contact Microsoft for help with their product.
Don't forget to rename all files back in the end (again, while VS IDE is not running).
Best regards,
Georg Zitzlsberger
- Subscribe to RSS Feed
- Mark Topic as New
- Mark Topic as Read
- Float this Topic for Current User
- Bookmark
- Subscribe
- Printer Friendly Page