I'd like to understand the excess overhead I'm measuring when submitting a sycl command group in the attached modified vector add example. Some key points:
- Vector add works on 100M complex elements and writes to output vector sum
- Target: CPU with 2 cores
- Profiling overall command group, and using sycl profiling to track submit time and execution time
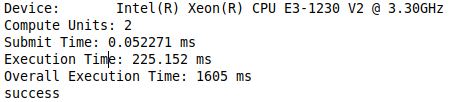
I'm finding that the overall execution time is about 7 times longer than the execution + submit time. I'm curious to know the source of the additional overhead when submitting the command group.
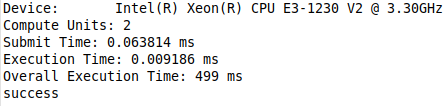
Even when the kernel has no work (comment contents in parallel for) and set array_size = 1, the overall overhead is still half a second (much larger than the kernel submit time or execution time)
Note: I'm using the latest Intel oneAPI DPC++ Compiler included in the Basekit_p_2021.1.0.2659 release.
Thanks for your help.
#include <CL/sycl.hpp>
#include <complex>
constexpr sycl::access::mode dp_read = sycl::access::mode::read;
constexpr sycl::access::mode dp_write = sycl::access::mode::write;
constexpr size_t array_size = 100000000;
typedef std::vector<std::complex<float>> IntArray;
//************************************
// Function description: initialize the array from 0 to array_size-1
//************************************
void initialize_array(IntArray &a) {
for (size_t i = 0; i < a.size(); i++){
float x = (float) i;
float y = -x;
a[i] = std::complex<float>(x, y);
}
}
//************************************
// Compute vector addition in DPC++ on device: sum of the data is returned in
// 3rd parameter "sum_parallel"
//************************************
void VectorAddInDPCPP(const IntArray &addend_1, const IntArray &addend_2,
IntArray &sum_parallel) {
auto property_list = cl::sycl::property_list{cl::sycl::property::queue::enable_profiling()};
sycl::queue q = cl::sycl::queue(sycl::cpu_selector{}, property_list);
// print out the device information used for the kernel code
std::cout << "Device: " << q.get_device().get_info<sycl::info::device::name>()
<< std::endl;
std::cout << "Compute Units: " << q.get_device().get_info<sycl::info::device::max_compute_units>()
<< std::endl;
// create the range object for the arrays managed by the buffer
sycl::range<1> num_items{array_size};
sycl::buffer<std::complex<float>, 1> addend_1_buf(addend_1.data(), num_items);
sycl::buffer<std::complex<float>, 1> addend_2_buf(addend_2.data(), num_items);
sycl::buffer<std::complex<float>, 1> sum_buf(sum_parallel.data(), num_items);
auto start_overall = std::chrono::system_clock::now();
// submit a command group to the queue by a lambda function that
// contains the data access permission and device computation (kernel)
auto event = q.submit([&](sycl::handler &h) {
auto addend_1_accessor = addend_1_buf.get_access<dp_read>(h);
auto addend_2_accessor = addend_2_buf.get_access<dp_read>(h);
auto sum_accessor = sum_buf.get_access<dp_write>(h);
h.parallel_for(num_items, [=](sycl::id<1> i) {
float real = addend_1_accessor[i].real() + addend_2_accessor[i].real();
float imag = addend_1_accessor[i].imag() + addend_2_accessor[i].imag();
sum_accessor[i] = std::complex<float>(real, imag);
});
});
event.wait();
auto end_overall = std::chrono::system_clock::now();
auto submit_time = event.get_profiling_info<cl::sycl::info::event_profiling::command_submit>();
auto start_time = event.get_profiling_info<cl::sycl::info::event_profiling::command_start>();
auto end_time = event.get_profiling_info<cl::sycl::info::event_profiling::command_end>();
auto submission_time = (start_time - submit_time) / 1000000.0f;
std::cout << "Submit Time: " << submission_time << " ms" << std::endl;
auto execution_time = (end_time - start_time) / 1000000.0f;
std::cout << "Execution Time: " << execution_time << " ms" << std::endl;
auto execution_overall = std::chrono::duration_cast<std::chrono::milliseconds>(end_overall - start_overall);
std::cout << "Overall Execution Time: " << execution_overall.count() << " ms" << std::endl;
}
//************************************
// Demonstrate summation of arrays both in scalar on CPU and parallel on device
//************************************
int main() {
// Vector Add using SYCL
IntArray addend_1 (array_size);
IntArray addend_2 (array_size);
IntArray sum_parallel (array_size);
initialize_array(addend_1);
initialize_array(addend_2);
VectorAddInDPCPP(addend_1, addend_2, sum_parallel);
// Vector Add on host single threaded
IntArray sum_scalar (array_size);
for (size_t i = 0; i < sum_scalar.size(); i++){
float real = addend_1[i].real() + addend_2[i].real();
float imag = addend_1[i].imag() + addend_2[i].imag();
sum_scalar[i] = std::complex<float>(real, imag);
}
// Verify both sum arrays are equal
for (size_t i = 0; i < sum_parallel.size(); i++) {
if ((sum_parallel[i] != sum_scalar[i])) {
std::cout << "i = " << i << " , sum_parallel[i].real() = " << sum_parallel[i].real() << std::endl;
std::cout << "i = " << i << " , sum_scalar[i].real() = " << sum_scalar[i].real() << std::endl;
std::cout << "fail" << std::endl;
return -1;
}
}
std::cout << "success" << std::endl;
return 0;
}