- Mark as New
- Bookmark
- Subscribe
- Mute
- Subscribe to RSS Feed
- Permalink
- Report Inappropriate Content
By default ITAC only displays "MPI" and "APPLICATION" in the event display.
- I've set VT_PCTRACE, but that only seems to allow me to pop up a source dialog, and even that does not show a back trace so that's fairly useless.
- I put VT_initialize/VT_finalize in my code, and create a bunch of state handles which as pass to VT_begin / VT_end.
None to any avail. What am I missing? What file should contain my routine names?
Victor.
Link Copied
- Mark as New
- Bookmark
- Subscribe
- Mute
- Subscribe to RSS Feed
- Permalink
- Report Inappropriate Content
Did you compile with debug symbols?
- Mark as New
- Bookmark
- Subscribe
- Mute
- Subscribe to RSS Feed
- Permalink
- Report Inappropriate Content
Yes. This is my typical compile line:
mpicxx -O2 -g -std=c++11 -trace -DVT -I/home1/apps/intel/itac/9.0.3.049/intel64/include -I../imp -I/work/00434/eijkhout/cppformat/cppformat -fpermissive -I.. -c mpi_base.cxx
I'm using Intel 15.0.2
V.
- Mark as New
- Bookmark
- Subscribe
- Mute
- Subscribe to RSS Feed
- Permalink
- Report Inappropriate Content
For the Intel compiler, you will also need to compile with -fno-omit-frame-pointer in order to get the call stack.
- Mark as New
- Bookmark
- Subscribe
- Mute
- Subscribe to RSS Feed
- Permalink
- Report Inappropriate Content
Ok, now I can see the call stack. Thanks.
- Is there a way to have the call stack refer to function names, rather than line numbers? I have VT_funcdef calls all over my code.
- The even display still says "User Code", even though it lists the MPI routine name in the MPI blocks.
- At some point I managed to have the Event Timeline and Message Profile side by side, but right now they are vertically oriented, and I can't figure out how to get them side by side again. Any hints?
V.
- Mark as New
- Bookmark
- Subscribe
- Mute
- Subscribe to RSS Feed
- Permalink
- Report Inappropriate Content
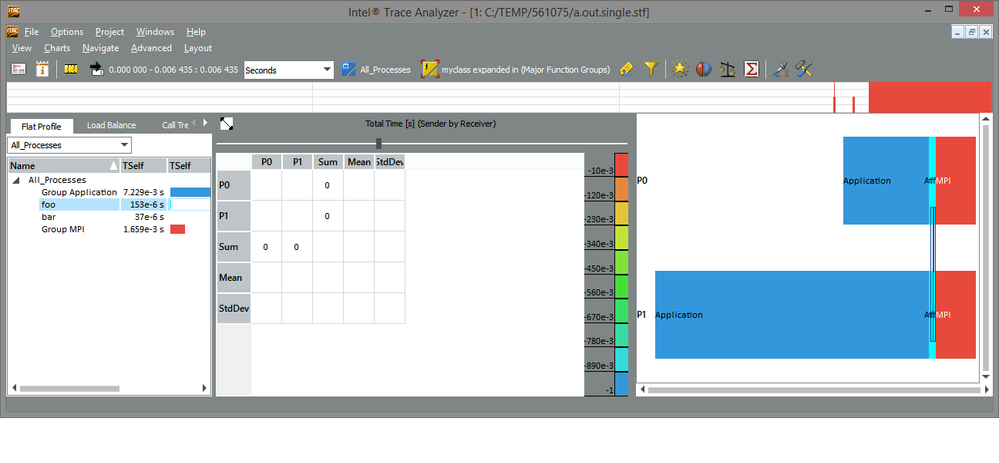
VT_funcdef is used to define a function handle. That handle needs to be seen by the routine at the time of calling VT_begin/VT_end. I'm attaching a simple example where I use VT_funcdef to define my functions and VT_begin/VT_end to signal the beginning and ending of each function. Anything not labeled will end up as Application:User_Code. To help differentiate, I also defined a separate class "myclass", but you can define your functions as part of the Application class if you want.
Try using the "Layout" option to change how the charts are arranged.
- Mark as New
- Bookmark
- Subscribe
- Mute
- Subscribe to RSS Feed
- Permalink
- Report Inappropriate Content
James, thanks for all the help.
- The Layout menu only seems to allow me to put the timeline elsewhere, not the Event Timeline
- Your example does not user VT_initialize / VT_finalize. Not needed?
- I'm using VT_NOCLASS instead of having an explicit class, but that shouldn't make a difference. Other than that I think I'm doing it right. Is there any way to inspect the stf files to see if the named events wind up in there?
Victor.
- Mark as New
- Bookmark
- Subscribe
- Mute
- Subscribe to RSS Feed
- Permalink
- Report Inappropriate Content
Turning on the Message Profile (empty for my example) and the Event Timeline, and turning off the Performance Assistant, when I chose Layout->Timelines to the Right, I got this.
If you are using MPI_Init and MPI_Finalize, the collection library will call VT_initialize and VT_finalize underneath those. You only need to explicitly call them if you aren't using MPI_Init and MPI_Finalize.
Using VT_NOCLASS will simply put it into the Application class alongside User Code. If you use xstftool, you can get a dump of the trace file which will include the functions. What I did for the example code I provided
xstftool a.out.single.stf --dump | grep foo
This gives me a line showing that I defined the state foo, then a line for every time I entered it, along with the movement direction on the stack and which rank did that.
- Subscribe to RSS Feed
- Mark Topic as New
- Mark Topic as Read
- Float this Topic for Current User
- Bookmark
- Subscribe
- Printer Friendly Page
