- Mark as New
- Bookmark
- Subscribe
- Mute
- Subscribe to RSS Feed
- Permalink
- Report Inappropriate Content
Hello,
I would like to collect MPI execution time data using ITAC.
I only want the whole time and I want only about the collective.
I don't want the results on a per-process basis.
As the number of processes increases, the number of files increases, and it is difficult to obtain results. Therefore, I want to make only one process write the result value using the environment variable VT_PROCESS, but it does not work properly.
I would appreciate it if you could see if the option I used had any problems.
This is my scripts.
source /opt/intel/20.0/itac/2020.0.015/bin/itacvar.sh
export VT_CHECKING_TRACING=ON
export VT_STATISTICS=OFF
export VT_LOGFILE-FORMAT=STFSINGLE
export VT_PROCESS="0:N off"
export VT_PROCESS="0 on"
or
export VT_PROCESS="1:N off"
mpiexec -trace -trace-collectives -genvall ./exec_file
Thank you in advance,
Kihang
- Mark as New
- Bookmark
- Subscribe
- Mute
- Subscribe to RSS Feed
- Permalink
- Report Inappropriate Content
Hi Kihang,
If you set the environment variable VT_LOGFILE_FORMAT=SINGLESTF, the itac groups all the .stf files into a single file.
From your question, I can see that you are already using that variable. But we can observe a mistake in the variable (replace the -hyphen with _ underscore in VT_LOGFILE-FORMAT=STFSINGLE). Maybe that is the reason you are not getting a single stf file.
Yes, the time taken for the 17280 processes will be larger than in 1728 since the relationship is non-linear.
When you set VT_PROCESS="1:N off" only the trace of process 0 will be collected. Let us know if you observe any unusual behavior.
Regards
Prasanth
Link Copied
- Mark as New
- Bookmark
- Subscribe
- Mute
- Subscribe to RSS Feed
- Permalink
- Report Inappropriate Content
Hi Kihang,
Thank you for posting in Intel Forums.
We are moving this query to Intel oneAPI HPC Forum for adequate response.
Regards,
Raeesa
- Mark as New
- Bookmark
- Subscribe
- Mute
- Subscribe to RSS Feed
- Permalink
- Report Inappropriate Content
Hi Kihang,
Thanks for reaching out to us!
Could you please let us know what you exactly mean by not working properly? Can you give more details?
Please share screenshots and error logs of your case? They will help us debug the issue better.
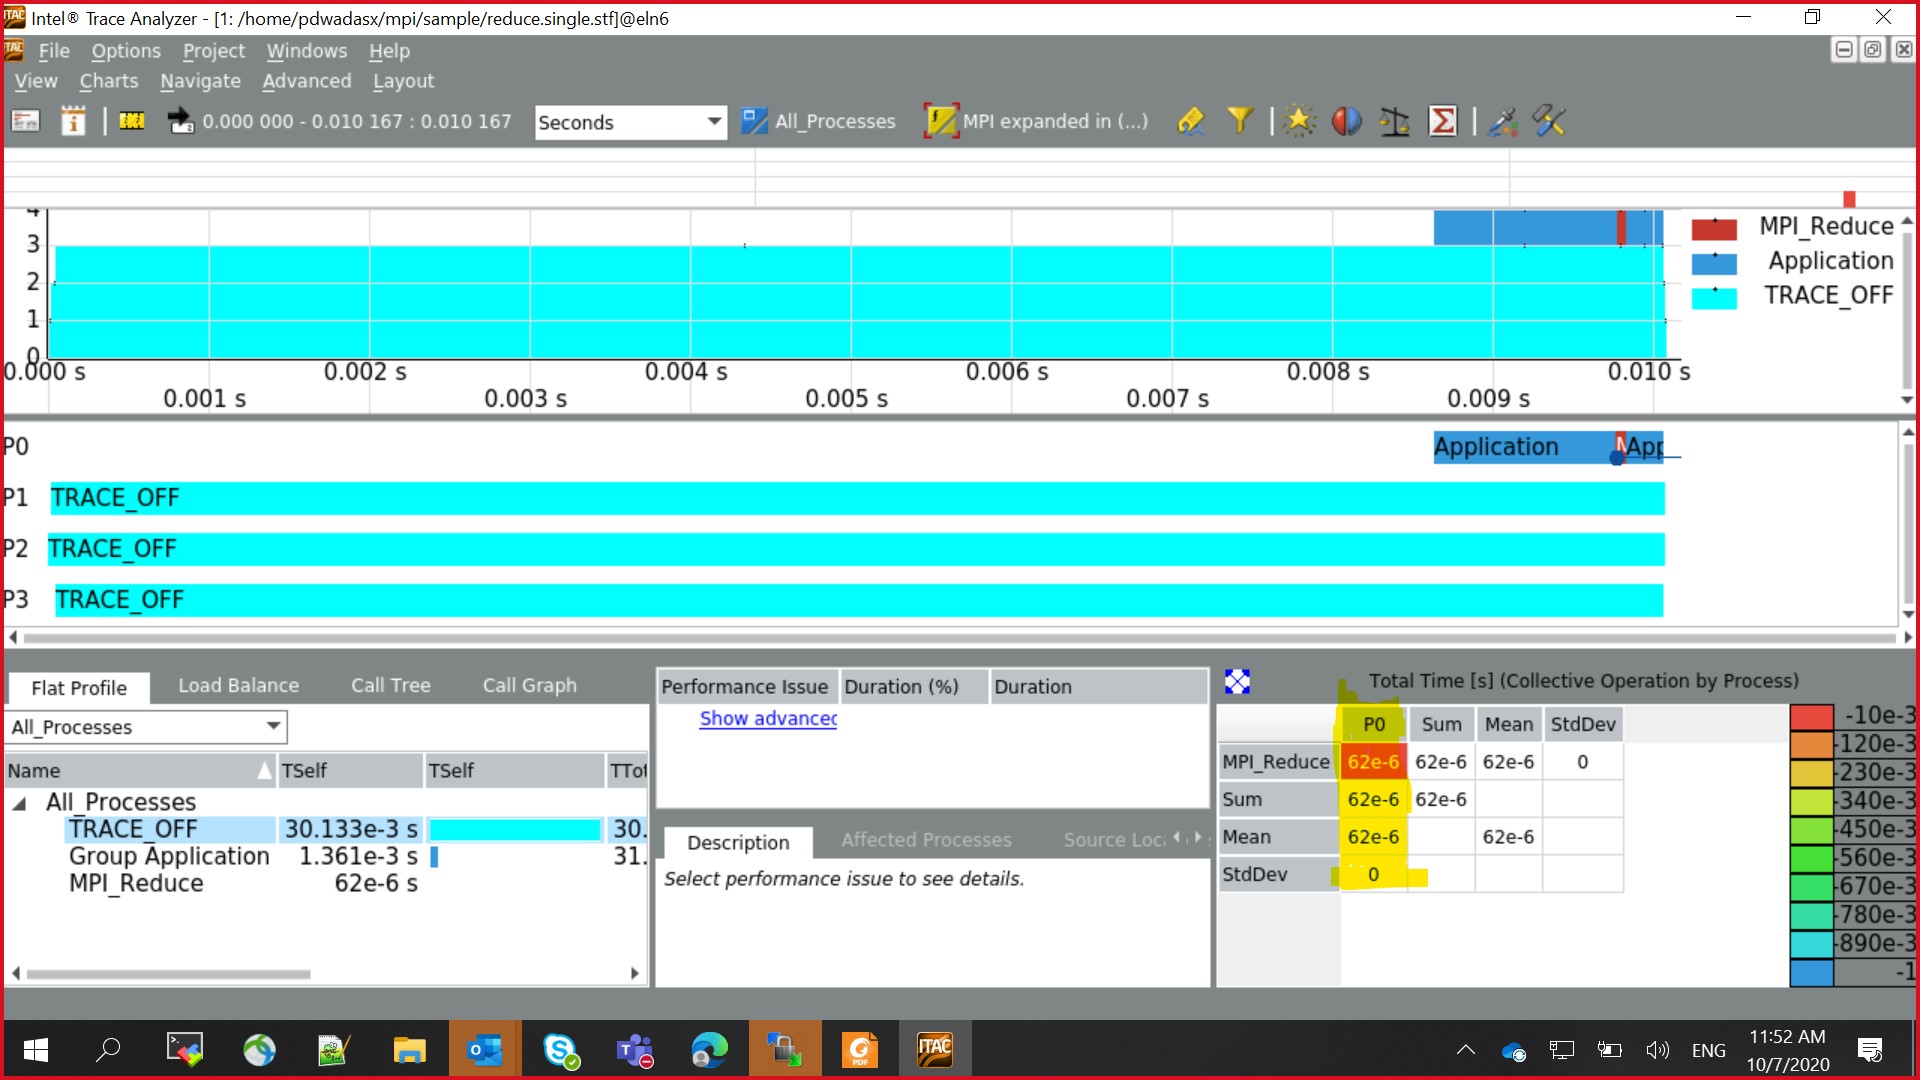
We are attaching a sample ITAC screenshot similar to your case in which only P0 trace is collected, for your reference.
Thanks and regards,
Prasanth
- Mark as New
- Bookmark
- Subscribe
- Mute
- Subscribe to RSS Feed
- Permalink
- Report Inappropriate Content
Hi Prasanth,
Let me write a little more about what doesn't work.
First of all, even if I set to trace only P0, the following problems exist.
- I am running with 17,280 mpi processors, and stf.f.$num, stf.f.$num.anc files come out each 17,280 and write them in the result file.
- When using 17,280 processors, it takes a lot of time to write a large number of result files (over 1 hour). If I use 1,728 processors, it takes around 1 minute.
What I'm really looking for is to get the result in the case of 17,280 used.
I only use P0 to write 2 result files (stf.f.0, stf.f.0.anc), or I want all processes to finish quickly even if they write down all files.
Regards,
Kihang
+In addition, error details that happen when I use a lot of processors are also attached.
- Mark as New
- Bookmark
- Subscribe
- Mute
- Subscribe to RSS Feed
- Permalink
- Report Inappropriate Content
Hi Kihang,
If you set the environment variable VT_LOGFILE_FORMAT=SINGLESTF, the itac groups all the .stf files into a single file.
From your question, I can see that you are already using that variable. But we can observe a mistake in the variable (replace the -hyphen with _ underscore in VT_LOGFILE-FORMAT=STFSINGLE). Maybe that is the reason you are not getting a single stf file.
Yes, the time taken for the 17280 processes will be larger than in 1728 since the relationship is non-linear.
When you set VT_PROCESS="1:N off" only the trace of process 0 will be collected. Let us know if you observe any unusual behavior.
Regards
Prasanth
- Mark as New
- Bookmark
- Subscribe
- Mute
- Subscribe to RSS Feed
- Permalink
- Report Inappropriate Content
As you said, when I use "VT_LOGFILE_FOMAT", it is properly created in one file.
One problem is that there is still a segmentation fault while collecting the results.
Depending on the number of processes used, it seems to occur and not, but is there any part of the environment setting (e.g., ulimit) that you need to care about?
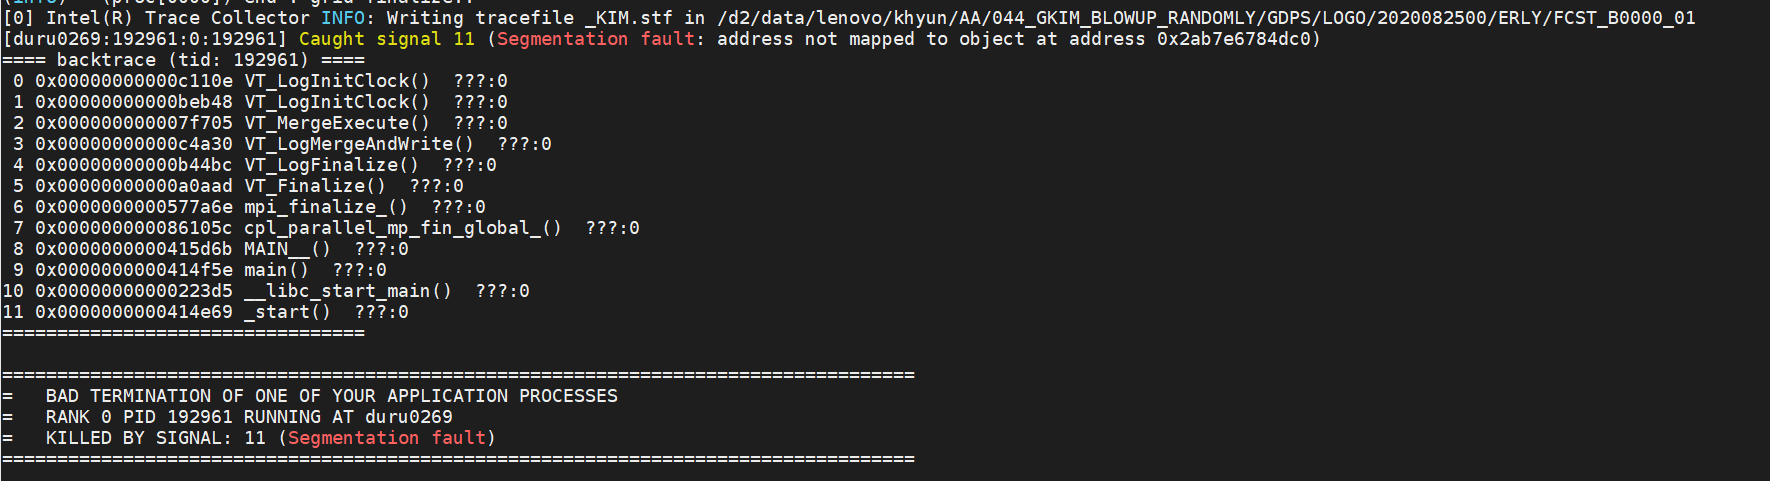
The error message is the same as the image in the previous post.
Caught signal 11 (Segmentation fault: address not mapped to object at address)
==== backtrace (tid: 133995) ====
VT_LogInitClock()
VT_LogInitClock()
VT_MergeExecute()
VT_LogMergeAndWrite()
VT_Finalize()
mpi_finalize_()
cpl_parallelmp_fin_global_()
MAIN__()
main()
__libc_start_main()
_start()
- Mark as New
- Bookmark
- Subscribe
- Mute
- Subscribe to RSS Feed
- Permalink
- Report Inappropriate Content
Hi Kihang,
Thanks for reporting the error.
Could you please provide the following details?
- the mpirun command line you were using.
- On how many nodes you were launching?
- Your environmental details? (cpuinfo, Interconnect, FI_PROVIDER)
- The output of ulimit -a
Also, we have observed that the metrics you were trying to collect were very high-level. In this case, APS tool is a lightweight alternative to ITAC.
To use APS to analyse MPI follow the bellow steps:
1) Set up the aps environment
source /opt/intel/performance_snapshots/apsvars.sh
export APS_STAT_LEVEL=6
2) Run the following command to collect data about your MPI application:
<mpi launcher> <mpi parameters> aps <my app> [<app parameters>]
eg: mpirun -np 20 aps ./reduce
A folder will be created with aps_result_[date]
3)Run aps command to generated the result (a HTML file will be created).
aps --report=aps_result_<date>
4) To generate specific reports like function profiling or collective profiling you can provide flags to aps-report command.
- aps-report ./aps_result_<postfix> -f # prints the function summary
- aps-report ./aps_result_<postfix> -c #prints time each rank spent in MPI collective operations
For more info on how to use APS please refer to https://software.intel.com/content/www/us/en/develop/documentation/application-snapshot-user-guide/top/analyzing-applications.html
Regards
Prasanth
- Mark as New
- Bookmark
- Subscribe
- Mute
- Subscribe to RSS Feed
- Permalink
- Report Inappropriate Content
Hi Prasanth,
- the mpirun command line you were using.
source ~/intel/20.0/itac/2020.0.015/bin/itacvars.sh
export VT_CHECK_TRACING=ON
export VT_STATISTICS=OFF
export VT_LOGFILE_FORMAT=SINGLESTF
export VT_PROCESS="1:N off"
mpiexec -trace -trace-collectives -genvall ./EXECUTE
- On how many nodes you were launching?
The number of nodes I want to use in the end is 17280 and it seems to be slowing down from over 13000 (not sure) - Your environmental details? (cpuinfo, Interconnect, FI_PROVIDER)
cpuinfo : Intel Xeon Platinum 8268
interconnect : Infiniband
FI_PROVIDER : ofi - The output of ulimit -a
core file size 0
data seg size unlimited
scheduling priority 0
file size unlimitied
pending signals 2317934
max locked memory unlimited
max memory size unlimited
open files 1048576
pipe size 8
POSIX message queues 819200
real-time priority 0
stack size 1048576
cpu time unlimited
max user processes 300
virtual memory 16777216
file locks unlimited
Thanks,
Kihang
- Mark as New
- Bookmark
- Subscribe
- Mute
- Subscribe to RSS Feed
- Permalink
- Report Inappropriate Content
Hi Kihang,
- From your reply, we are not able to figure out how many processes you were launching on how many nodes. Since in you command line there were no -n -r -ppn arguments.
- You have mentioned that you were using over 13000 nodes. In this context what do you mean by nodes?
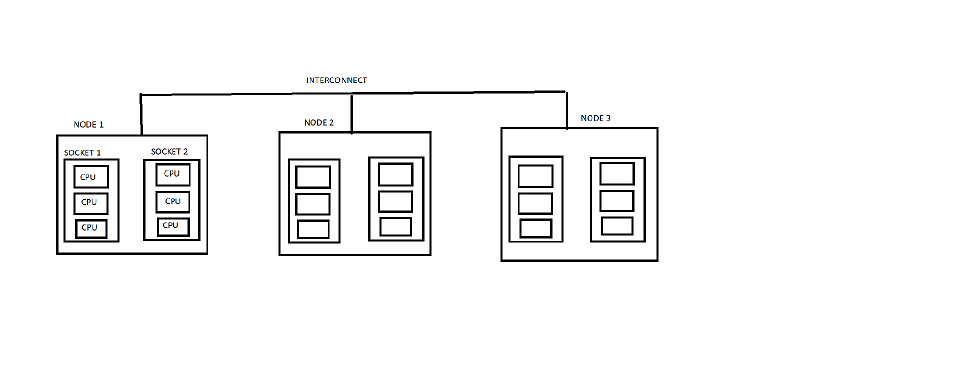
- I have provided a sample diagram describing our notation of nodes, sockets, CPU.
- We want to know how many processes you were launching on each node and total how many processes you were launching.
Regards
Prasanth
- Mark as New
- Bookmark
- Subscribe
- Mute
- Subscribe to RSS Feed
- Permalink
- Report Inappropriate Content
Hi Prasanth,
I am sorry to make you confused.
Before running an MPI program, I set the options related to a job scheduler (LSF).
So, I don't need to set the options related to processing like "-n -r -ppn" arguments.
My exact runtime options are as follows:
mpiexec -n 17280 -pin 48 -trace -trace-collectives -genvall ./EXECUTE
I am not sure why segfault occurs is the number of processors or insufficient installation.
Thanks
Kihang
- Mark as New
- Bookmark
- Subscribe
- Mute
- Subscribe to RSS Feed
- Permalink
- Report Inappropriate Content
- Mark as New
- Bookmark
- Subscribe
- Mute
- Subscribe to RSS Feed
- Permalink
- Report Inappropriate Content
Hi Kihang,
Thanks for providing the info we have asked for.
From your command line, we can see that you were launching 17280 processes with 48 processes per each node.
Since you haven't provided any hostfile or machinefile as an input, mpi will take the node names from the job scheduler.
Could you please specify how many nodes you were using?
Since you were using LSF, you can get the nodes info from $LSB_HOSTS environment variable.
Regards
Prasanth
- Mark as New
- Bookmark
- Subscribe
- Mute
- Subscribe to RSS Feed
- Permalink
- Report Inappropriate Content
Hi Prasanth,
I am currently using 360 nodes.
Is important how many nodes I used?
Thanks
Kihang
- Mark as New
- Bookmark
- Subscribe
- Mute
- Subscribe to RSS Feed
- Permalink
- Report Inappropriate Content
Hi Kihang,
The main reason I have asked for node info and the number of processes is to reproduce the issue. I am not able to reproduce the error before but since now I have the information I will get back to you soon.
Regards
Prasanth
- Mark as New
- Bookmark
- Subscribe
- Mute
- Subscribe to RSS Feed
- Permalink
- Report Inappropriate Content
Hi Kihang,
I have tried to reproduce your issue using multiple nodes and never got the error you have reported.
I am now escalating this issue to the concerned team for better support.
Thanks for being patient we will get back to you soon.
Regards
Prasanth
- Subscribe to RSS Feed
- Mark Topic as New
- Mark Topic as Read
- Float this Topic for Current User
- Bookmark
- Subscribe
- Printer Friendly Page