- Mark as New
- Bookmark
- Subscribe
- Mute
- Subscribe to RSS Feed
- Permalink
- Report Inappropriate Content
Hello,
I am trying to profile / trace MPI python code using the Intel Python off the OneAPI conda environment 2021.3.0
I've loaded the mpi, ITAC and VTune modules off OneAPI 2021.3.0 and I am using simply
$ mpirun -trace -np 2 python PythonCode ..
$ which python
~/software/x86_64/RHEL7/intel/oneapi/intelpython/latest/bin/python
mtml@labtusc0s000003[pts/3]devito $ module load intel/oneapi/vtune/latest
Loading vtune version 2021.6.0
I am getting
$ mpirun -trace -np 2 python examples/FWI/example_iso.py 10 550 550 210 1
python: symbol lookup error: /data/saet/U/software/x86_64/RHEL7/intel/oneapi/itac/2021.3.0/slib/libVT.so: undefined symbol: PMPI_Initialized
python: symbol lookup error: /data/saet/U/software/x86_64/RHEL7/intel/oneapi/itac/2021.3.0/slib/libVT.so: undefined symbol: PMPI_Initialized
Can we use MPI profiling tools with Intel Python? The python code is MPI enabled using mpi4py built with Intel mpiicc/mpiicpc
Thank you
Link Copied
- Mark as New
- Bookmark
- Subscribe
- Mute
- Subscribe to RSS Feed
- Permalink
- Report Inappropriate Content
Hi,
Thanks for reaching out to us.
>>Can we use MPI profiling tools with Intel Python?
Yes, we can use MPI profiling tools with Intel Python.
Could you please refer to this link for Tracing MPI Applications in Python:
Could you please try this and let us know if you are still facing any issues.
Thanks & Regards
Varsha
- Mark as New
- Bookmark
- Subscribe
- Mute
- Subscribe to RSS Feed
- Permalink
- Report Inappropriate Content
Varsha, thanks for the suggestion!
So in general I can initiate the tracing of any MPI code if I simply LD_PRELOAD libVT.so and libmpi.so ?
regards
Michael
- Mark as New
- Bookmark
- Subscribe
- Mute
- Subscribe to RSS Feed
- Permalink
- Report Inappropriate Content
Hi,
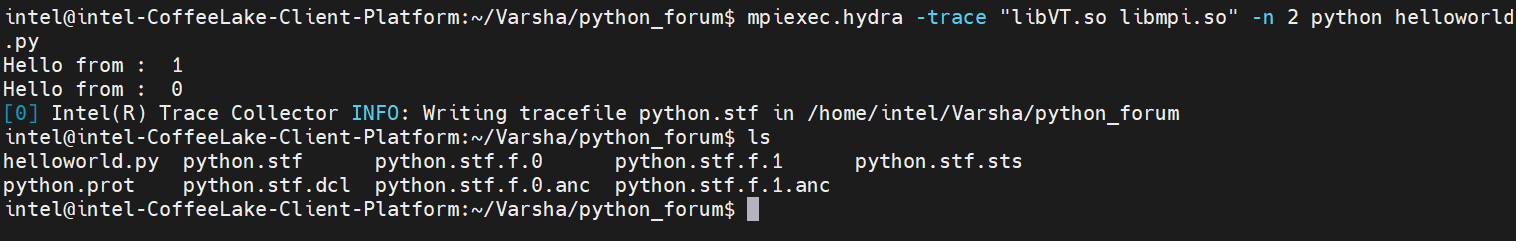
For creating a trace file for the MPI application where the code is written in Python you can use the below command.
mpiexec.hydra -trace "libVT.so libmpi.so" -n 2 python <filename>.py
We tried at our end using the above command and we are able to generate trace files, attaching a screenshot of it. Could you please let us know if you are facing any issues in creating the trace file?
If you want to do tracing without rebuilding please find the below command.
mpirun -trace -n 4 ./<filename>
You can use the LD_PRELOAD environment variable to point to the appropriate profiling library by exporting it in the below manner.
export LD_PRELOAD=libVT.so
Thanks & Regards
Varsha
- Mark as New
- Bookmark
- Subscribe
- Mute
- Subscribe to RSS Feed
- Permalink
- Report Inappropriate Content
Hi,
We haven't heard back from you. Could you please provide an update on your issue?
Thanks & Regards
Varsha
- Mark as New
- Bookmark
- Subscribe
- Mute
- Subscribe to RSS Feed
- Permalink
- Report Inappropriate Content
Hi,
We have not heard back from you. This thread will no longer be monitored by Intel. If you need further assistance, please post a new question.
Thanks & Regards
Varsha
- Subscribe to RSS Feed
- Mark Topic as New
- Mark Topic as Read
- Float this Topic for Current User
- Bookmark
- Subscribe
- Printer Friendly Page