- Mark as New
- Bookmark
- Subscribe
- Mute
- Subscribe to RSS Feed
- Permalink
- Report Inappropriate Content
I have a reproducible slowing down of calculations due to something which is going to be hard to track down so I welcome suggestions. I do not know if this is a memory leak, impi related, mkl related or what.
I first noticed it when one newish E5-2660 node was systematically running at ~1/2 the speed of others for mpi calculations, reproducibly. After rebooting it went back to running at the same speed as others, nothing else helped.
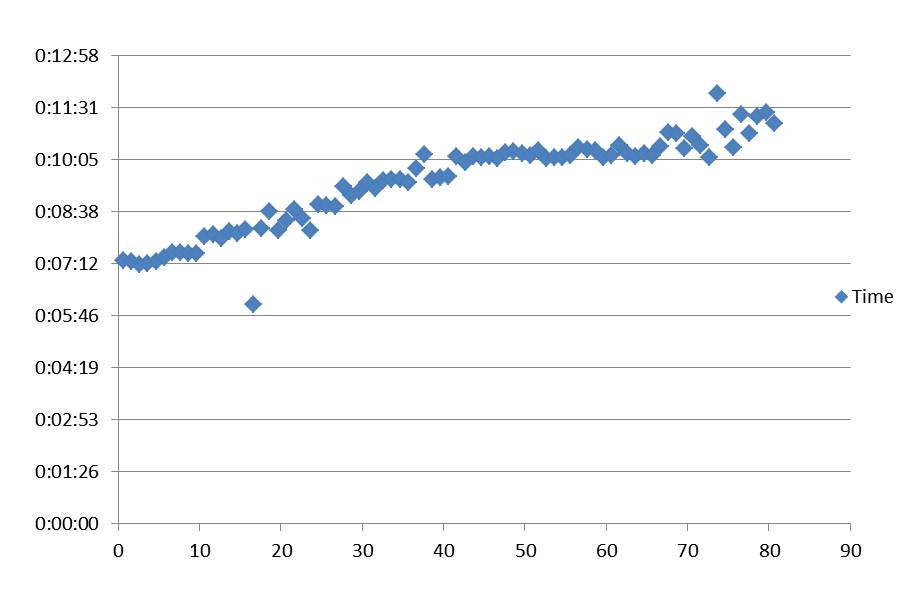
I have now reproduced a systematic slowing down for a long calculation. It is shown in the attached with the x axis iteration, the y axis time in minutes. Starting from ~ 7minutes the slowdown is approximately 6.25 seconds/iteration. This is a fairly big calculation with 64 cores and 835m/core (virtual). There is no indication that this is communications (infiniband) related, the slowdown is in CPU and WALL remains very close to this.
Obviously recompiling with debug on is not going to be a viable approach. Also a scatter debug strategy, for instance trying to add calls to release memory from mkl calls is going to be very painful as we are talking about ~1 day to test and >27000 lines of code written by others although I have written parts. Ideal would be innovative ideas to trace down why it has gone slow.
Suggestions?
For reference, I am using composer_xe_2013.2.146 and Intel impi. I don't see this on older E5410 nodes but I have not run enough iterations (yet, ongoing) to notice. The calculations are density-functional theory (DFT) calculations controlled by a tcsh script which repeatedly call a sequence of different mpi taks using mpirun (mpiexec.hydra) for each. This is a stable code (www.wien2k.at) used by ~2000 groups so while I cannot completely rule out programming errors it is unlikely to be something simple. The code heavily uses scalapack/blas/lapack calls for everything. In additon to static linking of the mkl scalapack etc the compilation options (ifort on a E5410 ) are (edited to remove some local options):
-FR -axAVX -mp1 -I$(MKLINC) -prec_div -r8 -pc80 -fpconstant -traceback -pad -align -O2 \
-ipo1 -i-static -fminshared -xHost -thread -assu buff -no-complex-limited-range -no-fast-transcendentals
I can provide more information if needed, but I cannot provide a simple code to reproduce the problem.
Link Copied
- Mark as New
- Bookmark
- Subscribe
- Mute
- Subscribe to RSS Feed
- Permalink
- Report Inappropriate Content
I was very lucky; the issue is related to cached memory and running
sync; echo 3 > /proc/sys/vm/drop_caches
solved the problem.
(see http://www.hosting.com/support/linux/clear-memory-cache-on-linux-server & http://www.linuxinsight.com/proc_sys_vm_drop_caches.html )
No idea why this occurred but obviously something (impi, mkl, ...) is leading to some combination of clean caches, dentries and inodes sitting in memory and degrading performance. What it is, that's above my pay grade.
- Mark as New
- Bookmark
- Subscribe
- Mute
- Subscribe to RSS Feed
- Permalink
- Report Inappropriate Content
Hi,
Can you restrict the program to run with only one MPI rank? Does this show the same slowdown?
Sincerely,
James Tullos
Technical Consulting Engineer
Intel® Cluster Tools
- Mark as New
- Bookmark
- Subscribe
- Mute
- Subscribe to RSS Feed
- Permalink
- Report Inappropriate Content
Sorry, that is not possible, the task being run is much, much too big for that.
After adding a cron task to clear the memory cache every 3 hrs (cron task sync; echo 3 > /proc/sys/vm/drop_caches) the problem has gone away permanently (I hope) although this is a patch not a cure.
- Mark as New
- Bookmark
- Subscribe
- Mute
- Subscribe to RSS Feed
- Permalink
- Report Inappropriate Content
Hi,
I agree, clearing the cache should not be necessary. I'm going to check with some other engineers here and see if anyone else has seen this behavior.
Sincerely,
James Tullos
Technical Consulting Engineer
Intel® Cluster Tools
- Mark as New
- Bookmark
- Subscribe
- Mute
- Subscribe to RSS Feed
- Permalink
- Report Inappropriate Content
Hi,
Please try using DAPL_UD.
[plain]I_MPI_DAPL_PROVIDER=ofa-v2-mlx4_0-1u
I_MPI_DAPL_UD_PROVIDER=ofa-v2-mlx4_0-1u
I_MPI_DAPL_UD=enable
I_MPI_DAPL_UD_RDMA_MIXED=enable[/plain]
Sincerely,
James Tullos
Technical Consulting Engineer
Intel® Cluster Tools
- Mark as New
- Bookmark
- Subscribe
- Mute
- Subscribe to RSS Feed
- Permalink
- Report Inappropriate Content
You may want to look at http://risc2.numis.northwestern.edu/ganglia/?m=mem_report&r=month&s=descending&c=risc2&h=&sh=1&hc=4&z=small
And look at the green of nodes 17-20. I am attaching a relevant graphs. The ganglia report showed only a small "Free Memory" although really that was because the memory was tied up in cache. You will see the drop in the cache after I turned on the cron job.
- Mark as New
- Bookmark
- Subscribe
- Mute
- Subscribe to RSS Feed
- Permalink
- Report Inappropriate Content
Hi,
I see. As I said, please try enabling DAPL UD. There is currently an issue with increasing memory usage in DAPL that might be the cause of this, and switching to DAPL UD prevents the increasing memory usage. I don't know if that is related to what you are seeing, but it is something to consider.
Sincerely,
James Tullos
Technical Consulting Engineer
Intel® Cluster Tools
- Subscribe to RSS Feed
- Mark Topic as New
- Mark Topic as Read
- Float this Topic for Current User
- Bookmark
- Subscribe
- Printer Friendly Page