- Mark as New
- Bookmark
- Subscribe
- Mute
- Subscribe to RSS Feed
- Permalink
- Report Inappropriate Content
The version of traceanalyzer : 2021.9.0
I have downloaded the test stf<poission_sendrecv.single.stf> from the official document. And I execcuted the command :
traceanalyzer ./ poisson_sendrecv.single.stf
But nothing happened.
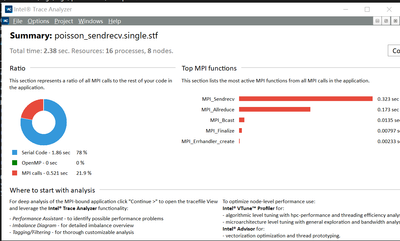
I remembered there is a summary page opened with the detailed information like in windows before. But now the command is not responding without any help info.
Could you tell me if traceanalyzer still supports to open the summary page in Linux ? like the following picture below:
If it supports , could you tell me how to get it ?
Thank you so much if any help info can be provided.
Link Copied
- Mark as New
- Bookmark
- Subscribe
- Mute
- Subscribe to RSS Feed
- Permalink
- Report Inappropriate Content
Hi,
Thanks for posting in Intel Communities.
Could you please provide your CPU, OS and hardware details to reproduce your issue at our end.
>>>I have downloaded the test stf<poission_sendrecv.single.stf> from the official document. And I execcuted the command
Are you referring to the following link:
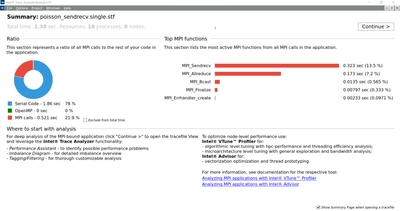
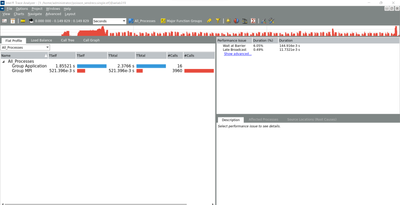
I followed the same steps after downloading "poisson_sendrecv.single.stf" from the site and I was able to view the summary page. Please refer to the below screenshots.
Here are my system details:
~$ mpirun --version
Intel(R) MPI Library for Linux* OS, Version 2021.9 Build 20230307 (id: d82b3071db)
Copyright 2003-2023, Intel Corporation.
~$ lscpu
Architecture: x86_64
CPU op-mode(s): 32-bit, 64-bit
Byte Order: Little Endian
Address sizes: 46 bits physical, 48 bits virtual
CPU(s): 96
On-line CPU(s) list: 0-95
Thread(s) per core: 2
Core(s) per socket: 24
Socket(s): 2
NUMA node(s): 2
Vendor ID: GenuineIntel
CPU family: 6
Model: 85
Model name: Intel(R) Xeon(R) Platinum 8260M CPU @ 2.40GHz
Stepping: 7
CPU MHz: 1000.251
CPU max MHz: 3900.0000
CPU min MHz: 1000.0000
BogoMIPS: 4800.00
Virtualization: VT-x
L1d cache: 1.5 MiB
L1i cache: 1.5 MiB
L2 cache: 48 MiB
L3 cache: 71.5 MiB
NUMA node0 CPU(s): 0-23,48-71
NUMA node1 CPU(s): 24-47,72-95
Vulnerability Itlb multihit: KVM: Mitigation: Split huge pages
Vulnerability L1tf: Not affected
Vulnerability Mds: Not affected
Vulnerability Meltdown: Not affected
Vulnerability Mmio stale data: Mitigation; Clear CPU buffers; SMT vulnerable
Vulnerability Retbleed: Mitigation; Enhanced IBRS
Vulnerability Spec store bypass: Mitigation; Speculative Store Bypass disabled via prctl and seccomp
Vulnerability Spectre v1: Mitigation; usercopy/swapgs barriers and __user pointer sanitization
Vulnerability Spectre v2: Mitigation; Enhanced IBRS, IBPB conditional, RSB filling, PBRSB-eIBRS SW sequence
Vulnerability Srbds: Not affected
Vulnerability Tsx async abort: Mitigation; TSX disabled
Flags: fpu vme de pse tsc msr pae mce cx8 apic sep mtrr pge mca cmov pat pse36 clflush dts acpi mmx fxsr sse sse2 ss ht tm pbe sysca
ll nx pdpe1gb rdtscp lm constant_tsc art arch_perfmon pebs bts rep_good nopl xtopology nonstop_tsc cpuid aperfmperf pni pclmu
lqdq dtes64 ds_cpl vmx smx est tm2 ssse3 sdbg fma cx16 xtpr pdcm pcid dca sse4_1 sse4_2 x2apic movbe popcnt tsc_deadline_time
r aes xsave avx f16c rdrand lahf_lm abm 3dnowprefetch cpuid_fault epb cat_l3 cdp_l3 invpcid_single intel_ppin ssbd mba ibrs i
bpb stibp ibrs_enhanced tpr_shadow vnmi flexpriority ept vpid ept_ad fsgsbase tsc_adjust bmi1 avx2 smep bmi2 erms invpcid cqm
mpx rdt_a avx512f avx512dq rdseed adx smap clflushopt clwb intel_pt avx512cd avx512bw avx512vl xsaveopt xsavec xgetbv1 xsave
s cqm_llc cqm_occup_llc cqm_mbm_total cqm_mbm_local dtherm ida arat pln pts hwp hwp_act_window hwp_epp hwp_pkg_req pku ospke
avx512_vnni md_clear flush_l1d arch_capabilities
~$ cat /etc/os-release
NAME="Ubuntu"
VERSION="20.04.5 LTS (Focal Fossa)"
ID=ubuntu
ID_LIKE=debian
PRETTY_NAME="Ubuntu 20.04.5 LTS"
VERSION_ID="20.04"
HOME_URL="https://www.ubuntu.com/"
SUPPORT_URL="https://help.ubuntu.com/"
BUG_REPORT_URL="https://bugs.launchpad.net/ubuntu/"
PRIVACY_POLICY_URL="https://www.ubuntu.com/legal/terms-and-policies/privacy-policy"
VERSION_CODENAME=focal
UBUNTU_CODENAME=focal
It may take some time for the trace analyzer to open the trace .stf file. So could you please wait for few minutes after calling the trace analyzer.
If you still face any issues, please check the system specifications with the following link and reach out to us:
https://www.intel.com/content/www/us/en/developer/tools/oneapi/trace-analyzer.html#gs.0hu2lq
Thanks & Regards,
Shaik Rabiya
- Mark as New
- Bookmark
- Subscribe
- Mute
- Subscribe to RSS Feed
- Permalink
- Report Inappropriate Content
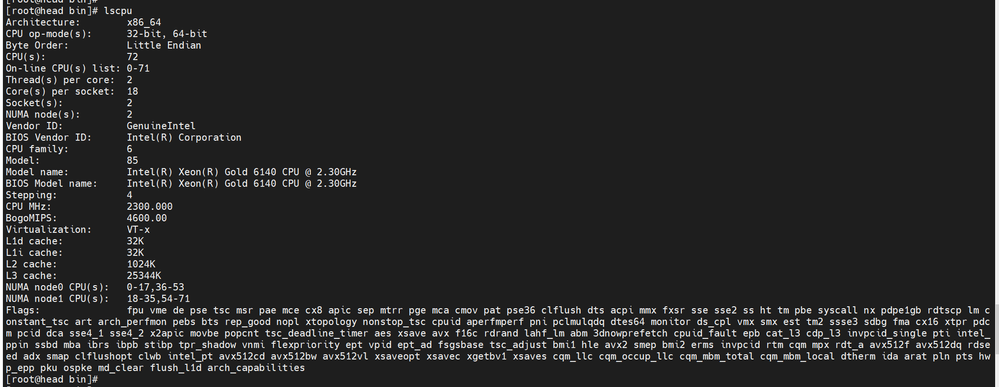
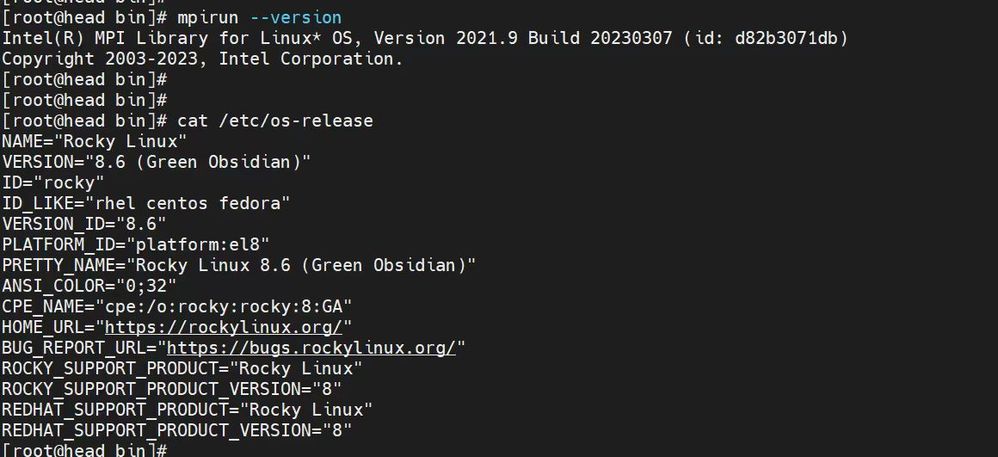
I checked the system specifications, and here are my system details:
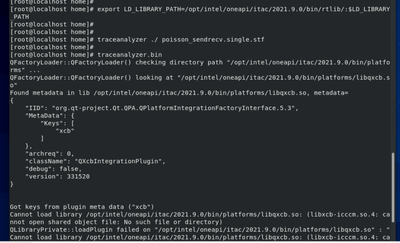
And when executing the command traceanalyzer.bin, the error happened:
And I checked the .so files , they are all in /opt/intel/oneapi/itac/2021.9.0/bin/rtlib and it seems that traceanalyzer cannot load them.
I have tested it in other machines and the error happened again. Could you provide any help? TT
Besides, I tested the command <advisor-gui>, it works!
Thanks.
- Mark as New
- Bookmark
- Subscribe
- Mute
- Subscribe to RSS Feed
- Permalink
- Report Inappropriate Content
Sorry for the repeat, ignore this reply please.
- Mark as New
- Bookmark
- Subscribe
- Mute
- Subscribe to RSS Feed
- Permalink
- Report Inappropriate Content
Sorry for the repeat, ignore this reply please.
- Mark as New
- Bookmark
- Subscribe
- Mute
- Subscribe to RSS Feed
- Permalink
- Report Inappropriate Content
I have checked the system and still faced this issue. And I have posted the information, thanks.
- Mark as New
- Bookmark
- Subscribe
- Mute
- Subscribe to RSS Feed
- Permalink
- Report Inappropriate Content
Sorry for the repeat, ignore this reply please.
- Mark as New
- Bookmark
- Subscribe
- Mute
- Subscribe to RSS Feed
- Permalink
- Report Inappropriate Content
Hi,
While executing traceanalyzer.bin, as the errors indicate that xcb files are not present in the path. Could you please set LD_LIBRARY_PATH to /opt/intel/oneapi/itac/2021.9.0/bin/rtlib as the .so files are present in that directory and try running the executable again?
The command for the same is:
export LD_LIBRARY_PATH=/opt/intel/oneapi/itac/2021.9.0/bin/rtlib/:$LD_LIBRARY_PATH
If you still face any issue, please reach out to us.
Thanks & Regards,
Shaik Rabiya
- Mark as New
- Bookmark
- Subscribe
- Mute
- Subscribe to RSS Feed
- Permalink
- Report Inappropriate Content
Hi,
I set the LD_LIBRAYR_PATH and the issue is still happened.
But the not found .so file is changed to libxcb-icccm.so.4 and I set /opt/intel/oneapi/installer/lib to the LD_LIBRAYR_PATH .
Finally, it works!
I downloaded the l_itac_oneapi_p_2021.9.0.43491_offline.sh and installed it . I'm not sure if it is the reason to this issue.
Anyway, thank you so much for your help.
- Mark as New
- Bookmark
- Subscribe
- Mute
- Subscribe to RSS Feed
- Permalink
- Report Inappropriate Content
Hi,
To resolve the error of missing .so files and platform plugin xcb, we have to follow the below steps:
- Before executing traceanalyzer we have to source the vars.sh script of Intel Trace Analyzer and Collector(ITAC)
source /opt/intel/oneapi/itac/2021.9.0/env/vars.sh2. The "traceanalyzer.bin" is not meant to be executable, you can check the execution with "traceanalyzer" command instead.
We needn't set path with LD_LIBRARY_PATH to .so files if we source vars.sh script of ITAC(Intel Trace Analyzer and Collector).
Thanks & Regards,
Shaik Rabiya
- Mark as New
- Bookmark
- Subscribe
- Mute
- Subscribe to RSS Feed
- Permalink
- Report Inappropriate Content
Hi,
Glad to know that your issue is resolved. If you need any additional information, please post a new question as this thread will no longer be monitored by Intel
Thanks & Regards,
Shaik Rabiya
- Subscribe to RSS Feed
- Mark Topic as New
- Mark Topic as Read
- Float this Topic for Current User
- Bookmark
- Subscribe
- Printer Friendly Page
