- Mark as New
- Bookmark
- Subscribe
- Mute
- Subscribe to RSS Feed
- Permalink
- Report Inappropriate Content
Hi, I'm trying to reconcile the behaviour I've seen since incorporating multiple threads into our application using the parallel_for technique. Basically the run time almost doubles when using multiple threads. I've isolated this by using a task_scheduler with 4 threads (running on a quad core machine) and then using a spin_mutex to control which parts of the loop are capable of running in parallel. If I synchronize access to the entire operator() this effectively means that each thread will wait until no others are running before executing their slice of the for loop, this gave me an execution time of about 43 seconds. I then gradually moved the mutex down so that more and more of the code was executed in parallel and the overall execution time kept on going up... when running without any synchronisation the execution time was around 112 seconds.
The model I am using is a command object which contains information about a network which we are using to building a shortest path. The m_ptCommand pointer contains shared information which is used to initialise the pathBuilder objects, however after initialisation they should not be contending for the same data (is that even a reason for such a slow down? all the data is stored as vectors internally and multiple threads reading from the same vector shouldn't cause such a dramatic effect should it?).
I have read that multithreading can make a program run slower, but the thing I can't understand is how it could make it run THIS MUCH slower? even seemingly running simple steps like constructing the Path, PathBuilder and Recorder objects in parallel results in a slow down. There has to be something I'm missing here, this can't all be caused by cache issues can it?
[cpp]void PtIterationDestinationRunner::operator()( const blocked_rangewhich is called like this& range ) const { // tbb::spin_mutex::scoped_lock lock(m_lock); // 41.5s
m_timestamps.push_back(make_tuple(tick_count::now(), m_id, "operator()-entered"));
PTPathBuilder ptPathBuilder(*m_ptCommand);
PtOutputRecorderController ptRecorderController(m_ptCommand, m_output);
shared_ptrpath = shared_ptr (new PtPath(*m_ptCommand, m_options));
m_timestamps.push_back(make_tuple(tick_count::now(), m_id, "operator()-initialised"));
// tbb::spin_mutex::scoped_lock lock(m_lock); // 43.4sec
for (int dest = range.begin(); dest != range.end(); ++dest)
{
runDestination(dest, ptPathBuilder, path, ptRecorderController);
}
m_timestamps.push_back(make_tuple(tick_count::now(), m_id, "operator()-finished-" +
ToString(range.begin()) + "-" + ToString(range.end())));
}
void PtIterationDestinationRunner::runDestination(int dest, PTPathBuilder& ptPathBuilder, shared_ptrpath, PtOutputRecorderController& ptRecorderController) const
{
int destOtNr = m_model->get_centroid(dest)->ot_pointnr();
int numOrigins = m_props->GetOriginsToAssignForDestination(destOtNr).size();
if (numOrigins == 0 && !m_options.doSkim()) return; // nothing to do here
// tbb::spin_mutex::scoped_lock lock(m_lock); // 45.2 seconds
ptPathBuilder.build(path, dest, m_options);
// tbb::spin_mutex::scoped_lock lock(m_lock); // 71.2 seconds
set::iterator classIterator = m_clazzes.begin();
for (; classIterator != m_clazzes.end(); ++classIterator)
{
int clazz = *classIterator;
int access_mode = m_props->GetAccessMode(clazz);
path->add_access_mode(access_mode);
ptPathBuilder.calc_access(path, access_mode);
ptRecorderController.Record(path, clazz);
}
// with no mutex at all run time is 112 seconds
}
[/cpp]
[cpp]PtIterationDestinationRunner destinationRunner(ptCommand, ptPathBuildOptions, output, timestamps);
tbb::task_scheduler_init init(4);
parallel_for(blocked_range(0, num_centroids, 100), destinationRunner);

[/cpp]
Link Copied
11 Replies
- Mark as New
- Bookmark
- Subscribe
- Mute
- Subscribe to RSS Feed
- Permalink
- Report Inappropriate Content
I thinkit should not be a grainsize issue, because serializing it more you increase the wall-clock time spent in every task, but the number of tasks is not affected. Though there is some additional contention inside TBB if tasks are short, it should not slow things down that much.
Seems it should not be an optimization issue either, since changing the line to place a mutex can hardly ever skew compiler optimization that much, and also it would not explain such gradual downstepping behavior.
So a data sharing & cache mississue is my best explanation.
I wonder whether you tried to run it by some profiler, and what were the results?
- Mark as New
- Bookmark
- Subscribe
- Mute
- Subscribe to RSS Feed
- Permalink
- Report Inappropriate Content
Quoting - Alexey Kukanov (Intel)
I thinkit should not be a grainsize issue, because serializing it more you increase the wall-clock time spent in every task, but the number of tasks is not affected. Though there is some additional contention inside TBB if tasks are short, it should not slow things down that much.
Seems it should not be an optimization issue either, since changing the line to place a mutex can hardly ever skew compiler optimization that much, and also it would not explain such gradual downstepping behavior.
So a data sharing & cache mississue is my best explanation.
I wonder whether you tried to run it by some profiler, and what were the results?
Alexey, thanks for your quick response.
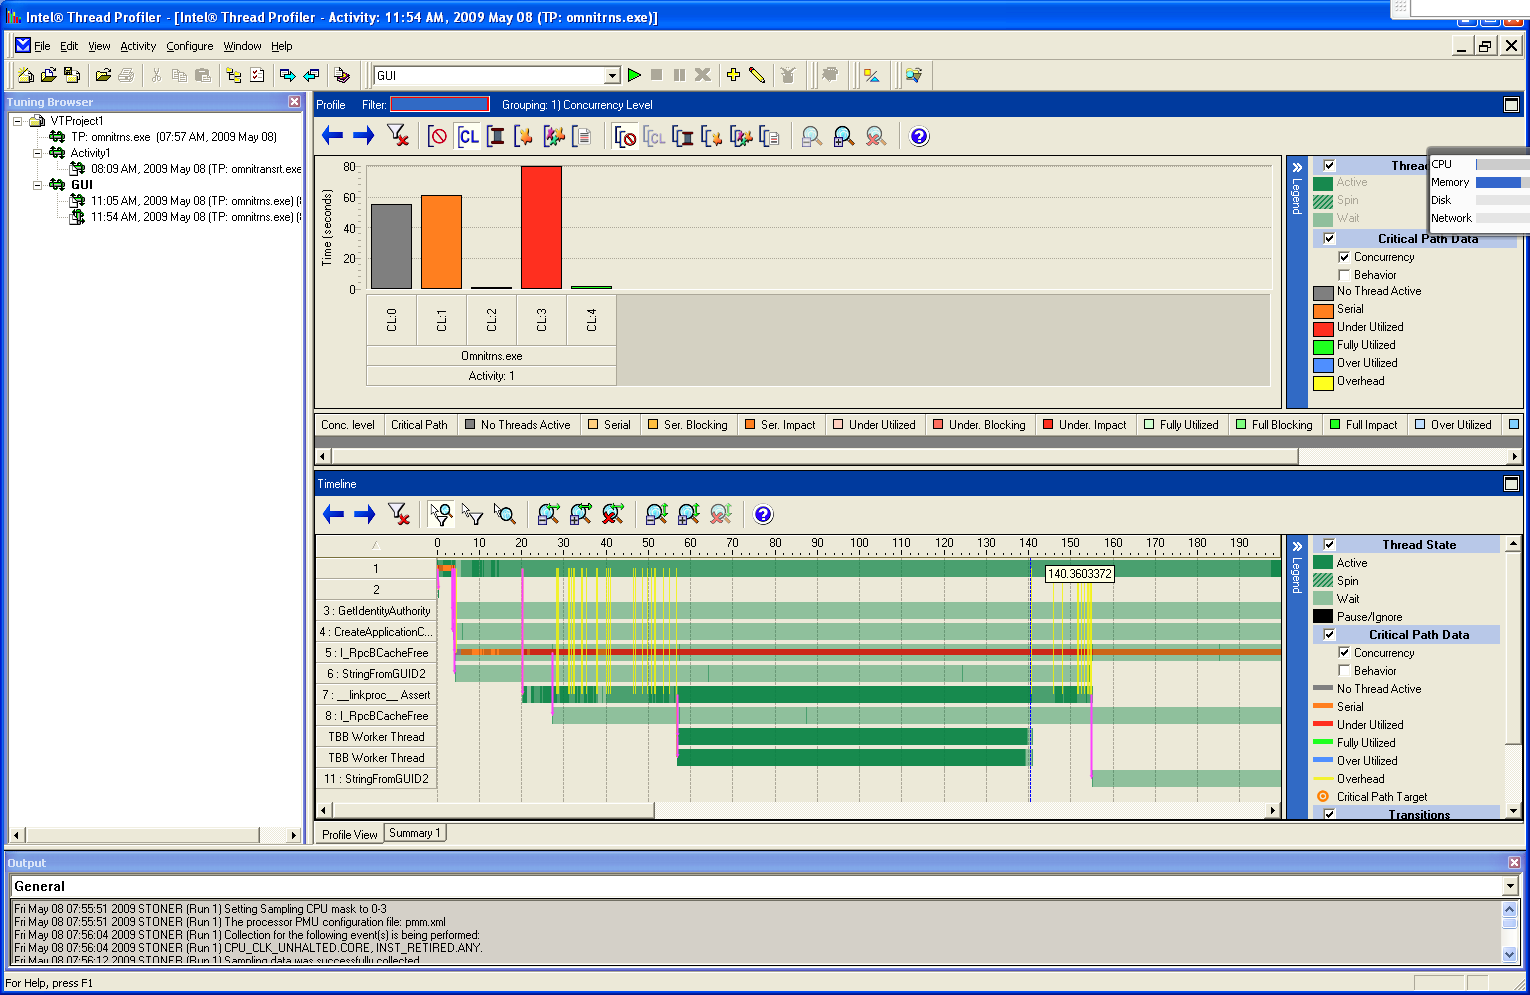
I've been trying out the Intel Threading Profiler and am attaching some results to this post. Interestingly, while setting up the profiler I think I have narrowed down the cause of our unexpected slowdown! Like the other thread I posted to in this group, I am writing a plugin DLL for an external application (unlike the other poster I am happy to use a dynamic linking model). The gotcha type moment came when I used the secondary executable that the external company provides for running their application, basically they provide a gui and command line version, to run all my previous tests I had been using the GUI, but I had grown tired of clicking the same thing over and over so I decided to set up the command line version to run the same profiling job and got the unexpected result - it all just worked with a runtime of ~ 17 seconds. Thats right, it gave a speed up of approximately 240% in the critical section!
So after pinching myself a few times to make sure I wasn't dreaming I reran it on the GUI version, same old result of 2.5 times SLOWER. Then I reran it on the command line, 2.5 times FASTER... so I have to conclude that it was a function of the GUI generating overhead with the worker threads. We have a pretty good working relationship with the application developers so I'd love to hear if you have any thoughts on what could cause this behaviour? I'm thinking perhaps the GUI is generating interupts or pushing out messages which interupt execution?
I'm currently trying to run the thread profiler over the GUI version, will post results when I manage to get it going.
Cheers, Jamie
- Mark as New
- Bookmark
- Subscribe
- Mute
- Subscribe to RSS Feed
- Permalink
- Report Inappropriate Content
I have now managed to get the thread profiler running over the gui version of the same job and have attached the output here, there doesn't seem to be any explicit overhead (ie yellow) going on during the run but we can see that the period where tbb threads have been spawned is considerably longer and also has a nasty "over utilized" coloring (dark blue) on the I_RpcBCacheFree thread... I'm pretty novice at interpreting this output but I'm guessing this means that there are too many threads trying to do work resulting in time-slicing of the cpus? I'm going to rerun without specifying the number of threads to the task_scheduler_init and generate more profiling results.
The other thing I notice is that the tbb worker threads are spawned from a different parent thread (compared to the previous command line run) in this case they are spawned from __linkproc__Assert whereas previously they were spawned from "1" (I'm guessing this is just the parent process thread of the executable that was launched). Any clues on what this linkproc might be? Google doesn't seem to generate any good info on it.
The other thing I notice is that the tbb worker threads are spawned from a different parent thread (compared to the previous command line run) in this case they are spawned from __linkproc__Assert whereas previously they were spawned from "1" (I'm guessing this is just the parent process thread of the executable that was launched). Any clues on what this linkproc might be? Google doesn't seem to generate any good info on it.
- Mark as New
- Bookmark
- Subscribe
- Mute
- Subscribe to RSS Feed
- Permalink
- Report Inappropriate Content
- Mark as New
- Bookmark
- Subscribe
- Mute
- Subscribe to RSS Feed
- Permalink
- Report Inappropriate Content
Quoting - jamiecook
Rerunning with 3 threads removes the over utilisation problem but does nothing for the fact that the parallel_for section still takes approximately 85 seconds.
Any suggestions gladly taken at this point
Any suggestions gladly taken at this point
Having said that I need to point out that it seems that those screenshots don't provide any insight into what's happening inside the application. And I think the problem is that you've not turned on support for Threading Analysis Tools (Thread Profiler and Thread Checker) on the TBB side (I'm assuming the applications profiled, use tbb::spin_mutexes, but unless support is turned on, you're not going to see transitions and the corresponding threading overhead as defined by Thread Profiler - the yellow component). To turn on support, please define the TBB_USE_THREADING_TOOLS macro somewhere before using TBB in your plugin (TBB Reference Manual section 2.6.2 talks about it in about as much detail as I just provided :) ).
Another thing I wanted to suggest to you is to run both versions: CL and GUI under VTune's basic Event-based sampling and collect Clock ticks and Instructions Retired. The difference in the outputs for CL and GUI versions should allow you to narrow down the causes for slow-down you observe in the GUI version.
- Mark as New
- Bookmark
- Subscribe
- Mute
- Subscribe to RSS Feed
- Permalink
- Report Inappropriate Content
Anton, thanks for getting involved.
I've been pulled onto another project at the moment so it'll be a few days before I can be fully free to experiment again, I'll make sure that when I do I compile with the flag you mentioned. I've also gotten correspondence from the application developers who have pointed out that the GUI thread is started with quite a high priority (this doesn't happen in the CL version)? Could this mismatch in priorities be a problem?
I'm glad you liked the screenshots, I'll keep posting the result of this project here when I return to it.
Jamie
- Mark as New
- Bookmark
- Subscribe
- Mute
- Subscribe to RSS Feed
- Permalink
- Report Inappropriate Content
Jamie,
What happens when you run the GUI version, enter arbitrary break point near top of program, then Freeze the GUI thread and continue? This will determine if the code placement in the linked immage is the problem or if the GUI thread itself is the problem. I suspect the latter.
Your O/S wasn't disclosed. In experimenting on a Windows XP Pro x64 system I have found some rather disturbing things with respect to how they (or how it looks they) implemented their scheduler. The problem I came across may relate to the problem you are observing. I hope I can explain what I observed and then you can relate it to your program and then derrive a workable soulution.
Running on a quad core Q6600 (XP x64) I had an application with 4 compute intensive threads plus an I/O thread. (all threads equal priority) This is an over subscription of threads. But this _should_ not matter (or so I thought)since periodically I could insert into the comput section some technique to yield some time when the I/O thread was noticed to have stalled (e.g. compute threads starved for data). The first attempt was to do nothing and let the O/S time slice (as what any O/S has done for me over the last 40 years). Relying on time slicing did not work as the I/O thread got blocked at a ReadFile. The nearest I could ascertain was the Virtual Memory remapping for the I/O thread had lower priority than currently running compute bound threads. And the virtualmemory for the I/O buffer wouldn't map until some runtime became available.
The next attempt to correct the problem was to insert SwitchToThread() in appropriate positions. This too did not work as apparently the compute threads would always squeeze in front of the I/O thread. So... Changing SwitchToThread() to Sleep(0) i.e. permit the current running thread to float (but in this case the threads were affinity locked). This did not work either. So... insert Sleep(1). While this works it is quite unsatisfactory.
Can you put on your thinking cap for a moment and think of a way to hook into the GUI and make a call here and there to Sleep for a few ms. This should not effect your display refresh too much as it sounds like you are only using the GUI to monitor progress. (as opposed to playing a video game). Also, the hook can lower the priority (but then the TBB threads might gobble up all the available run time).
Jim Dempsey
- Mark as New
- Bookmark
- Subscribe
- Mute
- Subscribe to RSS Feed
- Permalink
- Report Inappropriate Content
Anton,
I have recompiled and re-run with the flag you mentioned, however it does not seem to have had a great deal of impact on the (graphical) output of the thread profiler. I'm still getting essentially the same looking output but i'm able to dig down a bit deeper on the threads themselves to see how they were started etc but as the dll wasn't built with debug symbols it doesn't really show all that much... do you think it would be beneficial to try a full debug version? I'm worried that the debug environment won't really reflect the release environment (~ 5 times slower due to lack of intel compiler optimisations) and would probably mask the real problem.
I'm going to have a crack at getting this thing to run under VTune... I've not had a whole lot of luck in the past - instrumentation seems to hang without any explanation, hopefully i'll have more luck this time and be able to post some results.
Jim,
Unfortunately I don't have access to the GUI source, or even any way that I could get in there to pause it... unless you have some cool hackery that I am not aware of? We are simply provided two executables and a bunch of DLLs.
Regards,
Jamie
- Mark as New
- Bookmark
- Subscribe
- Mute
- Subscribe to RSS Feed
- Permalink
- Report Inappropriate Content
Jamie,
If you are on Windows using Visual Studio Debugger, set a break in your code _after_ the GUI has been called to initialize the display thread(s). Then when at the break point, there is a tab in the Debug window named Threads. Click on this tab and you will see a list of active threads for your applicaiton. One or more of these threads are used by the GUI, it may take you a little experimentation to figure out which. When you click on a thread int he Threads pane, then Right-Click on it and a pop-up comes up. One of the options is Freeze. Clicking on that will freeze the execution of that thread (when you continue execution). You can later Thaw a frozen thread. Using this technique you can load the GUI and initialize its threads, then experiment with it enabled and disabled.
With the experimentation you can narrow down what is causing the slow down. And hopefully fix it.
Potential problems are
1) code placement
2) The higher priority of the GUI thread(s) coupled with obtrusive coding practices within the GUI (written to assume it is the most importent thing running on your system).
3) Memory allocation of the GUI together with memory allocation for your applicaiton causing you to go from non-paging (no GUI) to paging (with GUI).
Most GUI's will not run independent of your application. The generally require a callback routine in your code to pass data and/or for synchronization. In this callback routine you can add code to test/set a one-shot flag and once only change the thread priority down to Normal (or lower). You can also add other code in the call back routines (e.g. SwitchToThread or Sleep(1), ...) with the objective of sacrificing GUI performance for productive work. It makes little sense for a non-watched display to suck 25% of the performance (or 75% in your case) out of the system simply to display a damb progress bar. In some of the applications I do, I run a dialog box as a dialog launched from aseperate thread. This dialog then can control the GUI (as opposed to the GUI being a thread of the main application). In my situation this was a necessity since the GUI I used was a bit flaky (had a memory leak) and would crash. Being driven from a seperate thread I had additional control over not crashing the application (after 3 days of computation).
Jim Dempsey
- Mark as New
- Bookmark
- Subscribe
- Mute
- Subscribe to RSS Feed
- Permalink
- Report Inappropriate Content
I am seeing behavior similar to Jamie. In my case thereare no GUI or third party libraries aside from Boost and Intel. Like Jamie, my data is contained in std::vectors. Here are some result comparisons:
The "body" classes forTBB and Boost are nearly identical:
After several days of refactoring my code for threading, hoping to see 1.5 min processing times drop below 30sec, it was a bit anti-climactic to see run-times instead go the other way(no fault of TBB as the Boost comparison shows). The bizarre thing is that I'm very surprised thatthe trendcode is so cache-sensitive, given that I had no such considerations in mind when I wrote itand rather expected it was very not-cache-friendly.
-- James --
[cpp]// ---- run the work ---- 1:36, 1:22
for (size_t i = 0; i < m_work_vec.size(); ++i)
	run_trend( i );[/cpp]
---
[cpp]// ---- run the work tbb ---- 7:21, 9:41 parallel_for( blocked_range---(0, m_work_vec.size() ), compute_trends_tbb(this), auto_partitioner() );[/cpp]
[cpp]// ---- run the work boost ---- 1 thread:  1:40, 1:32    2 threads:  5:58, 5:43
size_t midpoint = m_work_vec.size() / 2, endpoint = m_work_vec.size();
boost::thread thrd1( compute_trends_boost(this, 0, midpoint /*endpoint*/) );
boost::thread thrd2( compute_trends_boost(this, midpoint, endpoint ) );
thrd1.join();
thrd2.join();[/cpp]
---
The "body" classes forTBB and Boost are nearly identical:
[cpp]class mod_trend_runner::compute_trends_tbb
{
	mod_trend_runner * m_module;

public:
	// constructor
	compute_trends_tbb(mod_trend_runner * module ) : m_module( module )
	{}

	void operator()( const tbb::blocked_range<:SIZE_T>& r ) const
	{
		for( std::size_t i = r.begin(); i != r.end(); ++i )
			m_module->run_trend( i );
	}
};

class mod_trend_runner::compute_trends_boost
{
	size_t start, end;
	mod_trend_runner * m_module;

public:
	// constructor
	compute_trends_boost(mod_trend_runner * module, size_t startIndex, size_t endIndex) : m_module(module), start(startIndex), end(endIndex) { }

	void operator()()
	{
		for (size_t i = start; i < end; ++i)
			m_module->run_trend(i);
	}
};[/cpp]
A typical range size is about 10,000 trends. A telling result comes from the boost version, where one thread running 10,000 trends runsin nearly the same time as the purely serial version, but two threads, each running 5000 trends, runs inmore than doubletime of the serial version - instead of half the time, as I was expecting. This seems to support data sharing and cache miss issues as Alexey suggests.After several days of refactoring my code for threading, hoping to see 1.5 min processing times drop below 30sec, it was a bit anti-climactic to see run-times instead go the other way(no fault of TBB as the Boost comparison shows). The bizarre thing is that I'm very surprised thatthe trendcode is so cache-sensitive, given that I had no such considerations in mind when I wrote itand rather expected it was very not-cache-friendly.
-- James --
- Mark as New
- Bookmark
- Subscribe
- Mute
- Subscribe to RSS Feed
- Permalink
- Report Inappropriate Content
James,
Sometimes the slowdown is something non-obvious, at least until you run into the problem once or twice. The problems I am referring to are critical sections (or spinlock/mutex spots)in places that you might not be aware of -at least until you experience them. Memory allocation new/delete are bottlenecks. Consider using the TBB scalable allocator. The random number generator is another place for critical section.
If you program OpenMP using more threads than optimal. e.g. using Nested and using recursive functions.
Note, your snip of code could be from a recursive function. Depending on what your program is doing, you could potentially be creating 1000's of threads.
Time spent with a profiler can point to the problem. It is too easy to blame cache eviction on all your problems - often a small coding change is all that is required to get your performance back up to what is expected.
Jim Dempsey
Reply
Topic Options
- Subscribe to RSS Feed
- Mark Topic as New
- Mark Topic as Read
- Float this Topic for Current User
- Bookmark
- Subscribe
- Printer Friendly Page