- Mark as New
- Bookmark
- Subscribe
- Mute
- Subscribe to RSS Feed
- Permalink
- Report Inappropriate Content
I use parallel_for for done 5000 independent task:
task_scheduler_init init(nTreads);
...
parallel_for(blocked_range
and see on real time from number of used threads dependence.
It is about next:
nTreads=1 time=0.414635
nTreads=2 time=0.206995
nTreads=3 time=0.211466
nTreads=4 time=0.113038
nTreads=5 time=0.10937
nTreads=6 time=0.106635
nTreads=7 time=0.105713
nTreads=8 time=0.056962
One can see that between 2, 3 and among 4,5,6,7 number of threads there isn't almost any difference in time as for 2,4,8 we have normal speed up.
I look into the problem. I check time of begin and end of execution each parts of all tasks and number of task in each part.
void operator()(const blocked_range
#ifdef DEBUG_THREADS
pthread_t I = pthread_self();
// time_t seconds = time (NULL);
float tbb_sec = (tick_count::now()-time0).seconds();
TMyMutex::scoped_lock lock2;
lock2.acquire(mutex);
cout << "--------Begin time = " /*<< seconds << " (" */<< tbb_sec /*<< ")"*/ << " \top() ThrId=" << I << "\tCpuId=" << threadToCpuMap << " \t"<< range.begin() << "-" << range.end() << "=" << range.end()-range.begin() << endl;
lock2.release();
#endif // DEBUG_THREADS
for(int i = range.begin(); i != range.end(); ++i){
for(int j = 0; j < _NFits; j++){
Do(...);
}
}
#ifdef DEBUG_THREADS
// seconds = time (NULL);
tbb_sec = (tick_count::now()-time0).seconds();
TMyMutex3::scoped_lock lock3;
lock3.acquire(mutex3);
cout << "----------------End time = " /*<< seconds << " (" */<< tbb_sec /*<< ") "*/ << "op() ThrId=" << I << endl;
lock3.release();
#endif // DEBUG_THREADS
}
And see the problems:
1. parallel_for change size and number of portions (they are not same as given in blocked_range! )
2. and as some threads wait long time without work for end of program.
Actually I see next output:
nTreads=2
5000 tasks by 2500 tracks in group are run.
--------Begin time = 0.206564 op() ThrId=140472557516544 CpuId=0 0-2500=2500
--------Begin time = 0.206636 op() ThrId=1105668432 CpuId=0 2500-5000=2500
----------------End time = 4.37597op() ThrId=140472557516544
----------------End time = 4.38855op() ThrId=1105668432
nTreads=3
5000 tasks by 1666 tracks in group are run.
--------Begin time = 0.205496 op() ThrId=139694219429632 CpuId=0 0-1250=1250
--------Begin time = 0.20552 op() ThrId=1109252432 CpuId=0 1250-2500=1250
--------Begin time = 0.20552 op() ThrId=1113450832 CpuId=0 2500-3750=1250
----------------End time = 2.38136op() ThrId=139694219429632
----------------End time = 2.38259op() ThrId=1113450832
--------Begin time = 2.3826 op() ThrId=1113450832 CpuId=0 3750-5000=1250
----------------End time = 2.3882op() ThrId=1109252432
----------------End time = 4.47401op() ThrId=1113450832
Same picture for nThreads=4,5,6,7
I try as affinity_partitioner, as auto_partitioner and simple_partitioner, results are same.
So why parallel_for do such things and what can I do with it?
Thanks in advice for answer.
Link Copied
- Mark as New
- Bookmark
- Subscribe
- Mute
- Subscribe to RSS Feed
- Permalink
- Report Inappropriate Content
- Mark as New
- Bookmark
- Subscribe
- Mute
- Subscribe to RSS Feed
- Permalink
- Report Inappropriate Content
(Added) Apparently I was havinga race with Dmitriy, which he won... :-)
- Mark as New
- Bookmark
- Subscribe
- Mute
- Subscribe to RSS Feed
- Permalink
- Report Inappropriate Content
Done.
static auto_partitioner ap;
parallel_for(blocked_range
nTreads=1 time=0.420701
nTreads=2 time=0.211973
nTreads=3 time=0.155217
nTreads=4 time=0.111075
nTreads=5 time=0.110465
nTreads=6 time=0.111761
nTreads=7 time=0.105692
nTreads=8 time=0.0740918
nTreads=9 time=0.0843644
So for 2-3 problem gone. But for 5,6,7 it exist. And I lose speed up of factor 7-8 at nThreads=8,9
And anyway, why I shouldn't use grain size here?
How big my tasks should be to use another way? One task have about 1000 instructions. So one portion, which have about 500 tasks have 500 000 instructions, is it small?
- Mark as New
- Bookmark
- Subscribe
- Mute
- Subscribe to RSS Feed
- Permalink
- Report Inappropriate Content
- Mark as New
- Bookmark
- Subscribe
- Mute
- Subscribe to RSS Feed
- Permalink
- Report Inappropriate Content
Done.
static auto_partitioner ap;
parallel_for(blocked_range
nTreads=1 time=0.420701
nTreads=2 time=0.211973
nTreads=3 time=0.155217
nTreads=4 time=0.111075
nTreads=5 time=0.110465
nTreads=6 time=0.111761
nTreads=7 time=0.105692
nTreads=8 time=0.0740918
nTreads=9 time=0.0843644
So for 2-3 problem gone. But for 5,6,7 it exist. And I lose speed up of factor 7-8 at nThreads=8,9
Humm... well, plaese provide your debug output with "Begin Time"/"End time".
Probably there is actually some problem in TBB. Your debug output in first post reveals that TBB splits range into 4 1250-element subranges when 3 worker threads are used. That's quite wicked, because critical path length is 2500 elements, instead of 1666 elements.
- Mark as New
- Bookmark
- Subscribe
- Mute
- Subscribe to RSS Feed
- Permalink
- Report Inappropriate Content
Probably there is actually some problem in TBB. Your debug output in first post reveals that TBB splits range into 4 1250-element subranges when 3 worker threads are used. That's quite wicked, because critical path length is 2500 elements, instead of 1666 elements.
This suggests that TBB expects thread count to be 2^N. If so, is it documented? Speed-up for 1/2/4/8 threads is nearly perfectly linear. I would suggest someone from TBB team to take a closer look.
- Mark as New
- Bookmark
- Subscribe
- Mute
- Subscribe to RSS Feed
- Permalink
- Report Inappropriate Content
Humm... well, plaese provide your debug output with "Begin Time"/"End time".
Probably there is actually some problem in TBB. Your debug output in first post reveals that TBB splits range into 4 1250-element subranges when 3 worker threads are used. That's quite wicked, because critical path length is 2500 elements, instead of 1666 elements
--------Begin time = 0.211355 op() ThrId=1107675472 CpuId=0 4375-4531=156
--------Begin time = 0.211353 op() ThrId=1085725008 CpuId=0 3750-4062=312
--------Begin time = 0.211352 op() ThrId=1102223696 CpuId=0 2500-2812=312
----------------End time = 0.481244op() ThrId=1107675472
--------Begin time = 0.481253 op() ThrId=1107675472 CpuId=0 4531-4687=156
----------------End time = 0.751019op() ThrId=1107675472
--------Begin time = 0.751027 op() ThrId=1107675472 CpuId=0 4687-4843=156
----------------End time = 0.751148op() ThrId=1085725008
--------Begin time = 0.751159 op() ThrId=1085725008 CpuId=0 4062-4375=313
----------------End time = 0.751165op() ThrId=140566386259712
--------Begin time = 0.751175 op() ThrId=140566386259712 CpuId=0 312-625=313
----------------End time = 0.751179op() ThrId=1102223696
--------Begin time = 0.75119 op() ThrId=1102223696 CpuId=0 2812-3125=313
----------------End time = 1.02139op() ThrId=1107675472
--------Begin time = 1.0214 op() ThrId=1107675472 CpuId=0 4843-5000=157
----------------End time = 1.2936op() ThrId=1107675472
--------Begin time = 1.29361 op() ThrId=1107675472 CpuId=0 3125-3281=156
----------------End time = 1.2937op() ThrId=1085725008
----------------End time = --------Begin time = 1.29371 op() ThrId=1085725008 CpuId=0 1250-1562=312
1.29371op() ThrId=140566386259712
--------Begin time = 1.29373 op() ThrId=140566386259712 CpuId=0 625-937=312
----------------End time = 1.29381op() ThrId=1102223696
--------Begin time = 1.29382 op() ThrId=1102223696 CpuId=0 1875-2031=156
----------------End time = 1.56436op() ThrId=1107675472
--------Begin time = 1.56436 op() ThrId=1107675472 CpuId=0 3281-3437=156
----------------End time = 1.56457op() ThrId=1102223696
--------Begin time = 1.56458 op() ThrId=1102223696 CpuId=0 2031-2187=156
----------------End time = 1.83514op() ThrId=140566386259712
--------Begin time = 1.83515 op() ThrId=140566386259712 CpuId=0 937-1250=313
----------------End time = 1.83517op() ThrId=1107675472
--------Begin time = 1.83518 op() ThrId=1107675472 CpuId=0 3437-3593=156
----------------End time = 1.83531op() ThrId=1085725008
--------Begin time = 1.83533 op() ThrId=1085725008 CpuId=0 1562-1875=313
----------------End time = 1.83533op() ThrId=1102223696
--------Begin time = 1.83534 op() ThrId=1102223696 CpuId=0 2187-2343=156
----------------End time = 2.10628op() ThrId=1107675472
--------Begin time = 2.10629 op() ThrId=1107675472 CpuId=0 3593-3750=157
----------------End time = 2.10653op() ThrId=1102223696
--------Begin time = 2.10656 op() ThrId=1102223696 CpuId=0 2343-2500=157
----------------End time = 2.37909op() ThrId=1107675472
----------------End time = 2.37928op() ThrId=140566386259712
----------------End time = 2.37968op() ThrId=1102223696
----------------End time = 2.38038op() ThrId=1085725008
Prep[us], CPU fit/tr[us], Real fit/tr[us], CPU[sec], Real[sec] = 0 0.434 0.10846 8.68 2.16921
--------Begin time = 0.207883 op() ThrId=140596936767232 CpuId=0 0-312=312
--------Begin time = 0.207885 op() ThrId=1104042320 CpuId=0 2500-2812=312
--------Begin time = 0.207902 op() ThrId=1087711568 CpuId=0 3750-4062=312
--------Begin time = 0.207903 op() ThrId=1095158096 CpuId=0 1250-1562=312
--------Begin time = 0.207906 op() ThrId=1108240720 CpuId=0 625-781=156
----------------End time = 0.69326op() ThrId=1108240720
--------Begin time = 0.693273 op() ThrId=1108240720 CpuId=0 781-937=156
----------------End time = 0.754143op() ThrId=1104042320
--------Begin time = 0.754152 op() ThrId=1104042320 CpuId=0 2812-3125=313
----------------End time = 0.754331op() ThrId=1095158096
--------Begin time = 0.754343 op() ThrId=1095158096 CpuId=0 1562-1875=313
----------------End time = 0.758433op() ThrId=140596936767232
--------Begin time = 0.758442 op() ThrId=140596936767232 CpuId=0 312-625=313
----------------End time = 1.17833op() ThrId=1087711568
--------Begin time = 1.17834 op() ThrId=1087711568 CpuId=0 4062-4375=313
----------------End time = 1.1796op() ThrId=1108240720
--------Begin time = 1.17961 op() ThrId=1108240720 CpuId=0 937-1093=156
----------------End time = 1.30385op() ThrId=1104042320
--------Begin time = 1.30386 op() ThrId=1104042320 CpuId=0 3125-3437=312
----------------End time = 1.30438op() ThrId=1095158096
--------Begin time = 1.30439 op() ThrId=1095158096 CpuId=0 1875-2187=312
----------------End time = 1.3121op() ThrId=140596936767232
--------Begin time = 1.31211 op() ThrId=140596936767232 CpuId=0 1093-1132=39
----------------End time = 1.38115op() ThrId=140596936767232
--------Begin time = 1.38116 op() ThrId=140596936767232 CpuId=0 1132-1171=39
----------------End time = 1.45026op() ThrId=140596936767232
--------Begin time = 1.45029 op() ThrId=140596936767232 CpuId=0 1171-1210=39
----------------End time = 1.51942op() ThrId=140596936767232
--------Begin time = 1.51943 op() ThrId=140596936767232 CpuId=0 1210-1250=40
----------------End time = 1.5902op() ThrId=140596936767232
--------Begin time = 1.5902 op() ThrId=140596936767232 CpuId=0 4375-4531=156
----------------End time = 1.66678op() ThrId=1108240720
--------Begin time = 1.6668 op() ThrId=1108240720 CpuId=0 4687-4765=78
----------------End time = 1.85262op() ThrId=1104042320
--------Begin time = 1.85263 op() ThrId=1104042320 CpuId=0 3437-3750=313
----------------End time = 1.8528op() ThrId=1095158096
--------Begin time = 1.85281 op() ThrId=1095158096 CpuId=0 2187-2500=313
----------------End time = 1.86641op() ThrId=140596936767232
--------Begin time = 1.86642 op() ThrId=140596936767232 CpuId=0 4531-4687=156
----------------End time = 1.91043op() ThrId=1108240720
--------Begin time = 1.91044 op() ThrId=1108240720 CpuId=0 4765-4843=78
----------------End time = 2.14298op() ThrId=140596936767232
--------Begin time = 2.14299 op() ThrId=140596936767232 CpuId=0 4843-4882=39
----------------End time = 2.15476op() ThrId=1108240720
--------Begin time = 2.15477 op() ThrId=1108240720 CpuId=0 4921-4940=19
----------------End time = 2.15535op() ThrId=1087711568
--------Begin time = 2.15536 op() ThrId=1087711568 CpuId=0 4882-4891=9
----------------End time = 2.18338op() ThrId=1087711568
--------Begin time = 2.18339 op() ThrId=1087711568 CpuId=0 4891-4901=10
----------------End time = 2.21218op() ThrId=140596936767232
--------Begin time = 2.21219 op() ThrId=140596936767232 CpuId=0 4901-4906=5
----------------End time = 2.21407op() ThrId=1108240720
--------Begin time = 2.21408 op() ThrId=1108240720 CpuId=0 4940-4960=20
----------------End time = 2.21464op() ThrId=1087711568
--------Begin time = 2.21465 op() ThrId=1087711568 CpuId=0 4911-4913=2
----------------End time = 2.22086op() ThrId=1087711568
--------Begin time = 2.22087 op() ThrId=1087711568 CpuId=0 4913-4916=3
----------------End time = 2.22101op() ThrId=140596936767232
--------Begin time = 2.22101 op() ThrId=140596936767232 CpuId=0 4906-4911=5
----------------End time = 2.22986op() ThrId=140596936767232
--------Begin time = 2.22987 op() ThrId=140596936767232 CpuId=0 4960-4970=10
----------------End time = 2.23022op() ThrId=1087711568
--------Begin time = 2.23023 op() ThrId=1087711568 CpuId=0 4916-4918=2
----------------End time = 2.23656op() ThrId=1087711568
--------Begin time = 2.23657 op() ThrId=1087711568 CpuId=0 4918-4921=3
----------------End time = 2.246op() ThrId=1087711568
--------Begin time = 2.24601 op() ThrId=1087711568 CpuId=0 4980-4985=5
----------------End time = 2.2477op() ThrId=140596936767232
--------Begin time = 2.24771 op() ThrId=140596936767232 CpuId=0 4970-4980=10
----------------End time = 2.26155op() ThrId=1087711568
--------Begin time = 2.26155 op() ThrId=1087711568 CpuId=0 4985-4990=5
----------------End time = 2.26537op() ThrId=140596936767232
--------Begin time = 2.26538 op() ThrId=140596936767232 CpuId=0 4990-4992=2
----------------End time = 2.26906op() ThrId=140596936767232
--------Begin time = 2.26907 op() ThrId=140596936767232 CpuId=0 4992-4995=3
----------------End time = 2.2743op() ThrId=140596936767232
--------Begin time = 2.27431 op() ThrId=140596936767232 CpuId=0 4995-4997=2
----------------End time = 2.27651op() ThrId=1108240720
--------Begin time = 2.27652 op() ThrId=1108240720 CpuId=0 4997-4998=1
----------------End time = 2.27707op() ThrId=1087711568
--------Begin time = 2.27708 op() ThrId=1087711568 CpuId=0 4998-4999=1
----------------End time = 2.27783op() ThrId=140596936767232
--------Begin time = 2.27784 op() ThrId=140596936767232 CpuId=0 4999-5000=1
----------------End time = 2.27974op() ThrId=1108240720
----------------End time = 2.27977op() ThrId=140596936767232
----------------End time = 2.28017op() ThrId=1087711568
----------------End time = 2.40165op() ThrId=1104042320
----------------End time = 2.40166op() ThrId=1095158096
Prep[us], CPU fit/tr[us], Real fit/tr[us], CPU[sec], Real[sec] = 0.0005 0.5355 0.109698 10.71 2.19397
- Mark as New
- Bookmark
- Subscribe
- Mute
- Subscribe to RSS Feed
- Permalink
- Report Inappropriate Content
That is to be expected if you have 4 hardware threads, e.g., 4 non-hyperthreaded cores, or 2 hyperthreaded cores. Are you sure you aren't oversubscribing by asking for more than 4 worker threads?
"And anyway, why I shouldn't use grain size here?"
With simple_partitioner, it is essential, but auto_partitioner typically doesn't get that far down.
(Added) The original idea of having 5000/nThreads as a grainsize value was flawed because near the end the idle worker threads can't take over work from the worker threads that are still busy. The upside of bigger chunks without that much of adownside near the end is provided by auto_partitioner instead of simple_partitioner.
- Mark as New
- Bookmark
- Subscribe
- Mute
- Subscribe to RSS Feed
- Permalink
- Report Inappropriate Content
That is to be expected if you have 4 hardware threads, e.g., 4 non-hyperthreaded cores, or 2 hyperthreaded cores. Are you sure you aren't oversubscribing by asking for more than 4 worker threads?
I make test on machine with 8 cores + HT = 16 logical cores.
Also you should see results in first post in this thread(topic) - there I have speed up of factor 7.
- Mark as New
- Bookmark
- Subscribe
- Mute
- Subscribe to RSS Feed
- Permalink
- Report Inappropriate Content
Then why didn't you test all the way up to 16 threads?
And why do you say in #3 that you "lose speed up of factor 7-8 at nThreads=8,9" where I see efficiencies of 70% resp. 55%?
(Correction) Removed manifestation of unfounded paranoia.
- Mark as New
- Bookmark
- Subscribe
- Mute
- Subscribe to RSS Feed
- Permalink
- Report Inappropriate Content
Try something along the lines of:
size_t const K = 10; // coalition factor
... tbb::range(0, 5000 / K) ...
void body(size_t begin, size_t end)
{
begin *= K;
end *= K;
for (size i = begin; i != end; i += )
...
}
[Added] experiment with different values of K - 5, 10, 20, 40
- Mark as New
- Bookmark
- Subscribe
- Mute
- Subscribe to RSS Feed
- Permalink
- Report Inappropriate Content
Then why didn't you test all the way up to 16 threads?
And why do you say in #3 that you "lose speed up of factor 7-8 at nThreads=8,9" where I see efficiencies of 70% resp. 55%?
I haven't really studied auto_partitioner, but it does seem tailored for powers of 2. If I were in any way suspicious, I would think that Intel wanted to make 6-core processors look bad... ;-)
Into attachment you can see all data. This is for first case described in #1. From it I can suppose what I can just forget about HT. So I don't check it in case without grain-size.
Now, for case without grain-size I see that with 14-16 threads I really have speed up of factor about 7. So you right:).
Will be interesting to hear explanation of such differences between this two cases... But this is not a point now.
- Mark as New
- Bookmark
- Subscribe
- Mute
- Subscribe to RSS Feed
- Permalink
- Report Inappropriate Content
But that was a bad implementation, so its usability is limited.
Hmm, I would expect code that doesn't need to wait for memory accesses etc. to not show any additional benefits related to hyperthreading. Is that a fair assumption? Could that be the case here? But it would not explain any powers-of-two behaviour...
- Mark as New
- Bookmark
- Subscribe
- Mute
- Subscribe to RSS Feed
- Permalink
- Report Inappropriate Content
(Revoked) Please forget what you may have seen here. :-)
- Mark as New
- Bookmark
- Subscribe
- Mute
- Subscribe to RSS Feed
- Permalink
- Report Inappropriate Content
That is to be expected with the simple_partitioner and a grainsize value of 5000/3=1666: 5000>1666? yes, split. 2500>1666? yes, split. 1250>1666? no, execute. That's why the grainsize value provided should be an actual fixed grainsize, not an auto_partitioner-wannabe value, because auto_partitioner cannot truly be emulated that way. You need a combination of big ranges initially for lowest overhead and smaller ranges near the end for lower idle time.
#6 "This suggests that TBB expects thread count to be 2^N. If so, is it documented? Speed-up for 1/2/4/8 threads is nearly perfectly linear. I would suggest someone from TBB team to take a closer look."
But the output in #3 has no range size information (the information in #0 is for a different experiment, with simple_partitioner).
#7 "For nTreads=8 problem is same - it creates portion to run on thread with very small size - 1-2 task."
I assumed that when auto_partitioner is used, grainsize becomes largely irrelevant because the partitioner would not cut down that deep, unlike simple_partitioner, but apparently it does. You can still avoid that with a fixed grainsize (as it is meant to be). Experiment with some values, e.g., 10, 20, etc., like Dmitriy suggested (but implemented differently).
#8 "With simple_partitioner, it is essential, but auto_partitioner typically doesn't get that far down."
But you provided data that it does: sorry for not having paid enough attention to that when I wrote this.
#11 "If it's so, as a workaround you may try to enforce larger grain size."
Yes, but have you seen any evidence that grainsize is ignored when provided to blocked_range the "normal" way? I think that using blocked_range
#12 "Into attachment you can see all data."
What about at least numbers for auto_partitioner with grainsize 10 or somesuch?
#13 "Hmm, I would expect code that doesn't need to wait for memory accesses etc. to not show any additional benefits related to hyperthreading. Is that a fair assumption? Could that be the case here?"
Could you answer these questions?
(Added) Hmm, what exactly is the effect of hyperthreading on completely CPU-bound computation? Do both/all machine threads efficiently share whatever resources the core has at the same time (in which case my hypothesis just above is wrong), or does the core completely switch contexts when it has to wait for something external (in which case not going outside that much might indeed mean less advantage for hyperthreading)? Well, even if concurrent sharing happens, that may not do similar workloads any good because one type of resource is likely to remain a bottleneck. Does anyone know?
- Mark as New
- Bookmark
- Subscribe
- Mute
- Subscribe to RSS Feed
- Permalink
- Report Inappropriate Content
Done.
static auto_partitioner ap;
parallel_for(blocked_range
nTreads=1 time=0.420701
nTreads=2 time=0.211973
nTreads=3 time=0.155217
nTreads=4 time=0.111075
nTreads=5 time=0.110465
nTreads=6 time=0.111761
nTreads=7 time=0.105692
nTreads=8 time=0.0740918
nTreads=9 time=0.0843644
So for 2-3 problem gone. But for 5,6,7 it exist. And I lose speed up of factor 7-8 at nThreads=8,9
Results in #3 were just fluctuation.
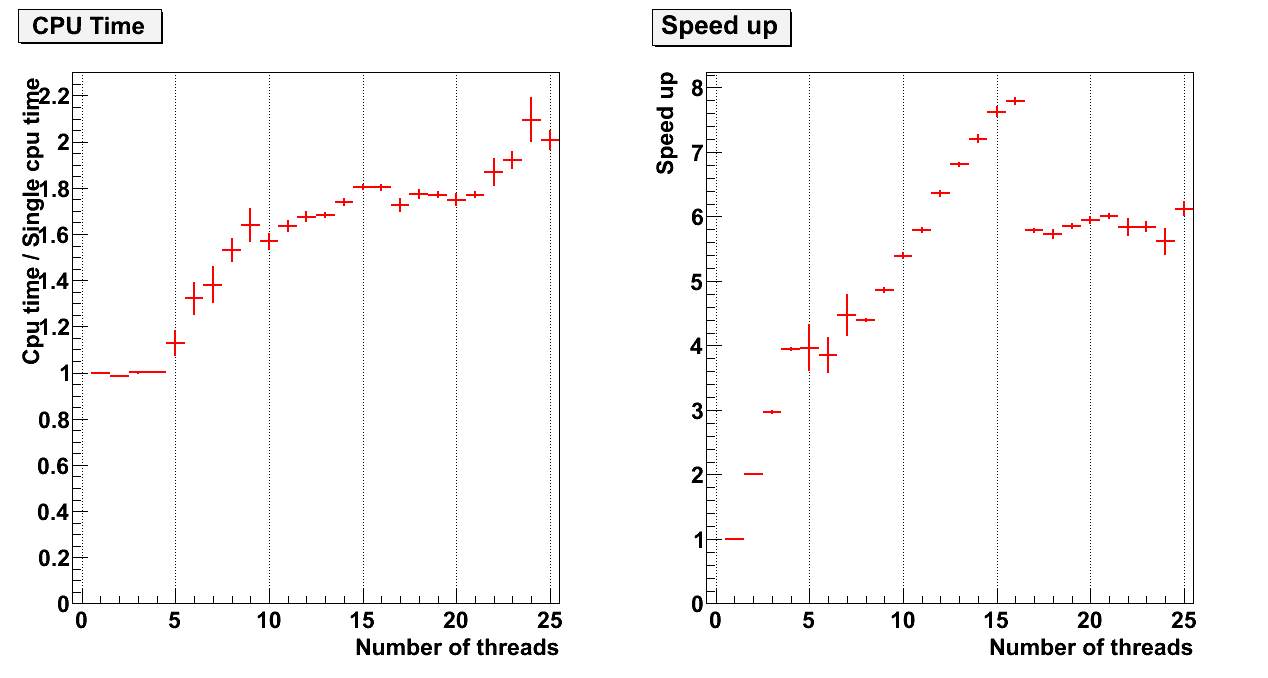
I collect statistic and get more or less normal results. (See in attachment tbbtime_1auto_fit1000_re1.png )
Also I try to write by myself procedure, which don't use standard tbb::range and can divide not only on 2^N (see parallel_for_simple.h in attachment). Results are little worse (than with auto_partitioner) - tbbtime_new_fit10_re100.png. But then I fix for each threads cpu to run I get very good and explainable dependence - tbbtime_new_fixthr_fit10_re100.png
So, Dmitrij, Raf, thank you for help and interesting discussion.
But there is one problem, when I try to write new procedure I have next problem:
then I do
TpfTask *a = new( allocate_child() ) TpfTask(currentTask,currentTask+portSize1-1,fBody);
cout << a << endl;
if (a) delete a;
I get next:
0x7f7373573940
*** glibc detected *** tbbVc: free(): invalid pointer: 0x00007f7373573940 ***
The pointers allocated with allocate_child() shouldn't be deleted by hands or what is the problem can be here?
- Subscribe to RSS Feed
- Mark Topic as New
- Mark Topic as Read
- Float this Topic for Current User
- Bookmark
- Subscribe
- Printer Friendly Page