- Mark as New
- Bookmark
- Subscribe
- Mute
- Subscribe to RSS Feed
- Permalink
- Report Inappropriate Content
Hey
Recently got a problem with my CPU. It's running at 3064MHz instead of 2940MHz
I have run the Diagnostic tool and this is the info I get:
--- IPDT64 - Revision: 3.0.0.23.W.MP
--- IPDT64 - Start Time: 28.01.2016 11.28.34
--------------------------------------------------------------------
Processor 1
--------------------------------------------------------------------
Genuine Intel CPU Test
Module Version: 1.0.12.64b.W
Start Time: Thu Jan 28 11:28:34 2016
Test Result - PASS
Expected: GenuineIntel
Detected: GenuineIntel
End Time: Thu Jan 28 11:28:35 2016
Total Time: seconds: 1
--------------------------------------------------------------------
Temperature Test
Module Version: 1.0.12.64b.W
Start Time: Thu Jan 28 11:28:35 2016
Test Result - PASS
Expected: Greater than 1 degrees below max
Received: 44 degrees below max
End Time: Thu Jan 28 11:28:36 2016
Total Time: seconds: 1
--------------------------------------------------------------------
CPU Brand String Test
Module Version: 1.0.12.64b.W
Start Time: Thu Jan 28 11:28:36 2016
Test Result - PASS
Expected String Parts: As Defined in BrandString_LocalConfig.xml
Detected: Intel(R) Core(TM) i7 CPU 870 @ 2.93GHz
End Time: Thu Jan 28 11:28:36 2016
Total Time: seconds: 0
--------------------------------------------------------------------
Module - CPUFreq.exe did not create a results file.
--------------------------------------------------------------------
--- IPDT64 - Temperature Monitor Results
Temperature Monitor will begin when CPULoad Test starts
Temperature Monitor Stopped
--------------------------------------------------------------------
System Information
------------------
Processor Name: Intel(R) Core(TM) i7 CPU 870 @ 2.93GHz
Processor Information: Intel64 Family 6 Model 30 Stepping 5
Number of Physical Cores: 4
Number of Logical Cores: 8
Installed System Memory: 8 GB
Operating System: Microsoft Windows 10 Pro 64-biters
Graphics Information: NVIDIA GeForce GTX 960
System Product: P55A-UD3
System BIOS: F11
--------------------------------------------------------------------
--- IPDT64 - End Time: 28.01.2016 11.28.37
--- IPDT64 - Result: Fail
--------------------------------------------------------------------
Link Copied
- Mark as New
- Bookmark
- Subscribe
- Mute
- Subscribe to RSS Feed
- Permalink
- Report Inappropriate Content
As far as I know my processor has no problems, but I wanted to run the tool because I saw the issue here.
I have the same problem, the diagnostic tool gives me the same error:
Module - CPUFreq.exe did not create a results file.
and
--- IPDT64 - Result: Fail
However when I let it loop (Tools--> Looping--> On):
--- IPDT64 - Revision: 3.0.0.23.W.MP
(...)
Brand String Module Success
Wrong argument type format for argument -htlr
Option -htlr invalid
Test Information
CPUFreq.exe compares the value between expected and detected CPU frequency
base clock frequency and QPI rate.
Possible options are as follows
-h Help or Usage this message
Example
CPUFreq.exe -h
-info Information switch publishes parallel information
using the following scheme
parallelyesnosocketyesnocoreyesno
Example
CPUFreq.exe -info
-resultName The resultName switch provides a way to name
the results file as desired.
This is for the convenience of the control program.
Example
CPUFreq.exe -resultName CPUFreq_results_01.txt
-c If present this option will display text in various colors
Example
CPUFreq.exe -c
-htlr d.dd Higher tolerance acceptable for detected CPU frequency
default is 0.05.
Example
CPUFreq.exe -htlr 0.06
-ltlr d.dd Lower tolerance acceptable for detected CPU frequency
default is 0.05.
Example
CPUFreq.exe -ltlr 0.06
-nc Skip the comparison test between expected and
detected CPU frequency base clock and QPI rate
will only display CPU frequency base clock and QPI rate.
Example
CPUFreq.exe -nc
-runtsc Use only TSC method to calculate detected CPU frequency
Example
CPUFreq.exe -runtsc
-rqty d Number of loop to run the CPU calculation method
to get a more stabilised CPU frequency value
default is 5 only applicable for APERFMPERF method
Example
CPUFreq.exe -rqty 10
-qpitlr d Acceptable tolerance for detected QPI rate
default is 5.
Example
CPUFreq.exe -qpitlr 5
-skiptest Skip CPUFreq test.
Example
CPUFreq.exe -skiptest
-skipqpi Skip QPI rate test.
Example
CPUFreq.exe -skipqpi
-d Debug option
Example
CPUFreq.exe -d
Dependencies
GlobalConfig.xml
CPUFreq_LocalConfig.xml
WinRing0x64.dll
WinRing0x64.sys
Copyright C 2015 Intel Corporation
CPUFreq has invalid arguments
Return Status 4
Module - CPUFreq.exe did not create a Results file.
IPDT64 Failed
I left the irrelevant information behind ( by (...) where the tool behaves normally).
Can somebody look into this because I think that it's an error inside the Intel Processor Diagnostic Tool (wrong arguments for CPUFreq).
I ran all the IPDT Test Modules in the command line, every test was successful.
- Mark as New
- Bookmark
- Subscribe
- Mute
- Subscribe to RSS Feed
- Permalink
- Report Inappropriate Content
The latest IPDT version should integrate CPU frequency detection improvement. The processor diagnostic tool should pass.
If there are no issues with your computer processing data it might be just a small problem with the processor diagnostic tool. I have been running the latest IPDT on several computers around my area and I did not get same IPDT64 Failed.
Make sure you have loaded default settings in BIOS and run the test again.
Allan.
- Mark as New
- Bookmark
- Subscribe
- Mute
- Subscribe to RSS Feed
- Permalink
- Report Inappropriate Content
I went back to default BIOS settings, I ran the test again but I have the same error.
Could you try to run the test but with a clean install of the tool (not an update). And please be sure that you have 3.0.0.23.W.MP and run the 64bit version which is provided here https://downloadcenter.intel.com/download/19792 Download Intel® Processor Diagnostic Tool .
The 32-bit https://downloadcenter.intel.com/download/19791 Download Intel® Processor Diagnostic Tool (32-bit) is another version, so please take the 64-bit version.
I also tried to run the 'cpufreq.exe -htlr' and I got the same error in cmd as I get when I loop the test, of course I got the same error because I didn't change the tolerance.
- Mark as New
- Bookmark
- Subscribe
- Mute
- Subscribe to RSS Feed
- Permalink
- Report Inappropriate Content
I checked again with a clean install of the old version and there is no problem with the old version, only with version 3.0.0.23W.MP
- Mark as New
- Bookmark
- Subscribe
- Mute
- Subscribe to RSS Feed
- Permalink
- Report Inappropriate Content
- Mark as New
- Bookmark
- Subscribe
- Mute
- Subscribe to RSS Feed
- Permalink
- Report Inappropriate Content
Hi,
I have this problem too. Version 2.20.0.0.W.MP-1_x64 works like a charm and version 3.0.0.23.W.MP_x64 does not.
- Mark as New
- Bookmark
- Subscribe
- Mute
- Subscribe to RSS Feed
- Permalink
- Report Inappropriate Content
Hello,
I have this problem, aswell, but my CPU DOESN'T works as it should.
I've got an i5 3470 @3.20GHz and when (trying to) playing games like Farcry 4 or Metalgear Solid 5 (if this is considered advertising, I'll edit my post), the CPU goes Airplane mode (jk, it turns really fast really loud), my screen blackens and I can't do anything else but pressing the power button of the Computer to reboot.
I'd like to reinstall the drivers, but i cannot find them. This Link is for the CPU, but it has no button to download.
https://downloadcenter.intel.com/download/22533/Intel-Graphics-Drivers-for-Intel-Core-Pentium-and-Celeron-Processors https://downloadcenter.intel.com/download/22533/Intel-Graphics-Drivers-for-Intel-Core-Pentium-and-Celeron-Processors
The Intel Driver Update Utility 2.4 wants to download the INF-Update-Utility-EXE, but fails for some reason it doesnt share with me.
After installing it manually, the Software still thinks I should install it. I installed the version 10.0.27
Computer specs:
http://www.directupload.net/file/d/4249/5wluj4zi_jpg.htm Directupload.net - 5wluj4zi.jpghttp://www.directupload.net/file/d/4249/5wluj4zi_jpg.htm http://www.directupload.net/file/d/4249/5wluj4zi_jpg.htm
http://www.directupload.net/file/d/4249/joyjs34r_png.htm Directupload.net - joyjs34r.png
It wasn't always like this, 2 months ago (last time i played games) i was able to play Fallout 4 without problems. The cooler-fan was noisy, indeed, but i was able to play with good graphics.
Now it crashes as described above with the lowest graphic setting possible.
Cheers
- Mark as New
- Bookmark
- Subscribe
- Mute
- Subscribe to RSS Feed
- Permalink
- Report Inappropriate Content
Hi,
This could indeed be a driver issue. Note that a CPU doesn't need a driver, the GPU needs one
For your integrated graphics, I would recommend https://downloadcenter.intel.com/download/25698/Intel-HD-Graphics-Driver-for-Windows-7-8-1-10-3rd-Gen-BYT- Download Intel® HD Graphics Driver for Windows 7*, 8.1*, 10 (3rd Gen & BYT)
For your dedicated graphics (the one that plays the games), I would recommend you to use this tool from Nvidia: http://www.geforce.com/geforce-experience/download Download GeForce Experience | NVIDIA | GeForce and check there for driver updates for your integrated graphics card. It also shows the recommended settings for the games that are supported by the tool. Once it's installed, you can access it by looking at your task bar in the right down corner where the nvidia logo is, click on it and select 'open geforce experience'. You can check for the most recent Nvidia drivers from the drivers tab, and at the games tab you can let the tool scan for games and let it show you the most optimal settings for your game.
I hope that this works.
- Mark as New
- Bookmark
- Subscribe
- Mute
- Subscribe to RSS Feed
- Permalink
- Report Inappropriate Content
Thanks for your reply Michael,
sadly it didnt help to install the driver, problem didn't change.
The NVidia driver was already installed and the Geforce Experience tool has no updates for me.
It's a little bit embaressing, the Intel Processor Diagnostic Tool tells me, I have only my standard VGA grafikchip installed.
(See link)
http://fs5.directupload.net/images/160201/cvqlq6hu.jpg http://fs5.directupload.net/images/160201/cvqlq6hu.jpg
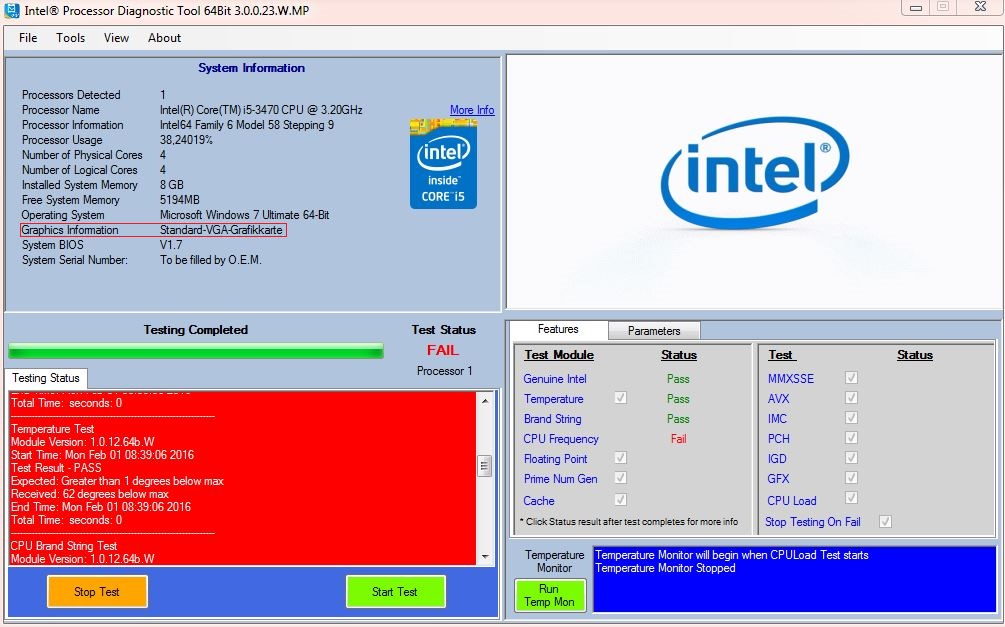
This really could be the root of my problem right? How do i tell the processor not to ignore my lovely grafik chip?
If it matters, both screens (VGA and HDMI) are plugged to the NVidia chip, so if its broken I shouldn't see something, right?
I'd appreaciate any hint,
Laurin
- Mark as New
- Bookmark
- Subscribe
- Mute
- Subscribe to RSS Feed
- Permalink
- Report Inappropriate Content
Hi,
It's 'normal' that the Intel Processer Diagnostic tool doesn't show the Nvidia graphics card, it shows only Intel products because it can test them.
If you want to be sure that your graphics card works properly (which I think it does, because like you say if it doesn't work you wouldn't be able to do anything) you can go to Device Manager and than you can select Graphics, there should be a Nvidia and an Intel GPU listed. If there is no 'unknown device' listed or an exclamation mark in a yellow triangle visible there is normally no problem.
Can you check your driver version in Geforce Experience (just to be sure )? It should say for your graphics card:
Version 361.75
Freigabedatum: 2016.1.27
If the version is not correct you can check for updates in the driver tab of Geforce Experience in the upper right corner.
Or you can download it over here http://www.nvidia.de/download/driverResults.aspx/97790/de NVIDIA DRIVERS GeForce Game Ready Driver WHQL
Could you also check if the appropriate settings are used to play your games in the Geforce Experience (if you play on too high settings it may also cause problems).
Go to the Geforce Experience and do this:
1) go to the Games tab
2) scan for games if there are no games listed
3) see if the settings are optimized, or see if there is a setting that is too high
You can also check in the Nvidia Control Panel if the settings for your games are correct (if it uses the right graphics card, like you said):
1) go to the Nvidia Control Panel (click on the Nvidia icon on your task bar, and go to Nvidia control panel)
2) go to manage 3D settings
3) go to program settings
4) look for your games in the list
5) click on a game and check if the Nvidia GPU is selected at number 2. of that page.
Also, make sure that the Windows updates are installed, this could be a temporary bug that has been resolved already.
I hope that this works, if it doesn't work don't be afraid to ask!
- Mark as New
- Bookmark
- Subscribe
- Mute
- Subscribe to RSS Feed
- Permalink
- Report Inappropriate Content
The NVidiachip is fine (says the device manager), but the standard VGA chip has an yellow "!", it has following message: "Device cannot be started. (Code 10)"
My nvidia driver version is 10.18.13.6175, from the 22.01.2016.
The Geforce Experience has both games listed (MGS5 and FC4). In both games there is optimal setting, but just a "-" at the current setting, which makes me believe it hasn't been startet.
So I thought to download the current chipsetdriver from http://de.msi.com/support/mb/B75MAP45.html# down-driver&Win7%2064 MSI Deutschland - B75MA-P45, but I couldn't install the On-Board VGA Drivers, it says "I don't have the minimum requirements to install the software" but I definitivly have the MSI B74MA-P45 mainboard (looked inside the PC).
While the PC was open i thought to run FC4 another time, to check if the other 3 drivers I installed had some effect. I noticed that the fan of the NVidia chip also increases its frequency-rotation and for the first time the fans went down after the game crashed. (turned the PC fast down to prevent that it gets too hot).
In the Nvidia Control Panel is FC4 listed. It says everywhere "using global settings" and "controlled by application". (with an NVidia logo).
I got no clue what to do
Have a good night,
Laurin
- Mark as New
- Bookmark
- Subscribe
- Mute
- Subscribe to RSS Feed
- Permalink
- Report Inappropriate Content
My CPU is skylake i5 6500 .I used intel diagnostic tool and I recevied a message as like "CPUFreq.exe did not create a Results file" .And right side on the screen I saw CPU frequency fail.What is that means.Is there a problem?
- Mark as New
- Bookmark
- Subscribe
- Mute
- Subscribe to RSS Feed
- Permalink
- Report Inappropriate Content
It's normal, it's a problem in the Intel Processor Diagnostig Tool. Don't worry about it We all have this same problem on our good working processors.
- Mark as New
- Bookmark
- Subscribe
- Mute
- Subscribe to RSS Feed
- Permalink
- Report Inappropriate Content
Okay, you have the most recent version, but maybe the Nvidia graphics driver hasn't installed correctly, try this:
1) Download this one: http://www.nvidia.de/download/driverResults.aspx/97790/de NVIDIA DRIVERS GeForce Game Ready Driver WHQL
2) Install the driver but in the step 'options' select 'advanced'.
3) Select in the next tab: 'do a clean install'
4) Click next and the driver will be installed and all the previous configurations will be removed, this way if there was a fault, it will be corrected.
About your standard VGA chip: also remove that driver, reboot again and install this driver: https://downloadcenter.intel.com/download/25698/Intel-HD-Graphics-Driver-for-Windows-7-8-1-10-3rd-Gen-BYT- Download Intel® HD Graphics Driver for Windows 7*, 8.1*, 10 (3rd Gen & BYT) (Don't forget that you need the 64-bit version! Not the 32-bit version!)
- Mark as New
- Bookmark
- Subscribe
- Mute
- Subscribe to RSS Feed
- Permalink
- Report Inappropriate Content
Alright, i did the clean installation.
After i deleted the grafic drivers (via the device manager) and rebooted.
After reboot a window popped up and told me the VGA drivers are installed (didn't do nothing but reboot) and told me to reboot again.
So I did and got the Code 10 Error ín Device Manager. Than i deleted the driver again via device manager and installed the 64bit drivers from your link.
The .exe extracted itself to tell me my system doesnt have the minimum requirements to install.
I tried starting FC4 and as the fan turned up again, I ran the IntelProcessor Diagnostic Tool. It told me my temperature is 50° below max.
Should I maybe check the temperature of the grafik chip? Which program would I use?
Thank you so much for your continuous help!!
- Mark as New
- Bookmark
- Subscribe
- Mute
- Subscribe to RSS Feed
- Permalink
- Report Inappropriate Content
Okay, this is pretty weird...
To know which temperature your system has, you can use this: http://www.almico.com/sfdownload.php http://www.almico.com/sfdownload.php You can download it from where it says download and where Speedfan 4.51 is in blue. The banner at the top of the site is an ad...
It's a program called speedfan and it gives you the temperature of your processor, graphics card and some other components.
Maybe you can also check the reliability monitor in Windows together with the Windows event viewer. Those are two things that keep track of the events on your computer. Problems on your computer will be marked in the reliability monitor with an error mark or with an exclamation mark in a yellow triangle.
- Mark as New
- Bookmark
- Subscribe
- Mute
- Subscribe to RSS Feed
- Permalink
- Report Inappropriate Content
According to this articel https://technet.microsoft.com/en-us/library/cc748864%28v=ws.10%29.aspx Start Reliability Monitor I only have a performance monitor, not a reliability monitor when starting via perfmon :/ I clicked through all the options and couldnt encounter a yellow ! triangle.
A picture; http://www.directupload.net/file/d/4253/i3a8cagv_jpg.htm http://www.directupload.net/file/d/4253/i3a8cagv_jpg.htm
Holy sh*t. The event viewer shows me for applications 1572 Errors and 2062 warnings. Total number of events is 31821.
And for system 710 errors.
I thought already about wiping windows, it's the only option left for me here, right? :/
- Mark as New
- Bookmark
- Subscribe
- Mute
- Subscribe to RSS Feed
- Permalink
- Report Inappropriate Content
Oh, that's weird... Maybe you can try and go to the action center (that flag on the taskbar) and there you should be able to access the reliability monitor.
Wiping windows is indeed the 'short and easy' way to do it normally it should help indeed.
If you had plans to upgrade to Windows 10, I would do that first (if you don't, yeah then don't )
If you re-install Windows 7, be sure to first update Windows completely and then install the most recent drivers only (those on the site of the manufacturer can be old already so look out which ones are good and which ones aren't).
Maybe you can still identify the real problem by looking into the reliability center to some errors, but indeed re-installing Windows is also a great idea.
- Mark as New
- Bookmark
- Subscribe
- Mute
- Subscribe to RSS Feed
- Permalink
- Report Inappropriate Content
My graphics card is intel hd530 embeded with i5 skylake.Driver is correct and last version but problem is same too.CPU frequency is fail.
- Mark as New
- Bookmark
- Subscribe
- Mute
- Subscribe to RSS Feed
- Permalink
- Report Inappropriate Content
FINALLY found the reliability monitor. http://www.directupload.net/file/d/4253/oiea4tp6_jpg.htm Directupload.net - oiea4tp6.jpg but I dont have a clue what its trying to tell me. I cant scroll with the arrows on the left or right side the the current date :/
Pretty sure im going to get Win 10.
Thanks a lot michael, its been a relief to have you!!
- Subscribe to RSS Feed
- Mark Topic as New
- Mark Topic as Read
- Float this Topic for Current User
- Bookmark
- Subscribe
- Printer Friendly Page