- Mark as New
- Bookmark
- Subscribe
- Mute
- Subscribe to RSS Feed
- Permalink
- Report Inappropriate Content
Hello,
I try to use IoT Analytics service
- Connect and activate device
- Register temp sensor
- Create observation
root@quark0176e8:~# iotkit-admin observation temp 25
2014-09-04T03:09:04.346Z - info: Sending attributes...
2014-09-04T03:09:09.283Z - info: Submitting:  n=temp, v=25
2014-09-04T03:09:15.807Z - info: Response received:  response=none detail, status=0
2014-09-04T03:09:15.815Z - info: Observation Sent response=none detail, status=0

root@quark0176e8:~# tail  /tmp/agent.log
{"n":"temp","v":"25","level":"info","message":"Submitting: ","timestamp":"2014-09-04T03:09:09.298Z"}
{"response":"none detail","status":0,"level":"info","message":"Response received: ","timestamp":"2014-09-04T03:09:15.809Z"}
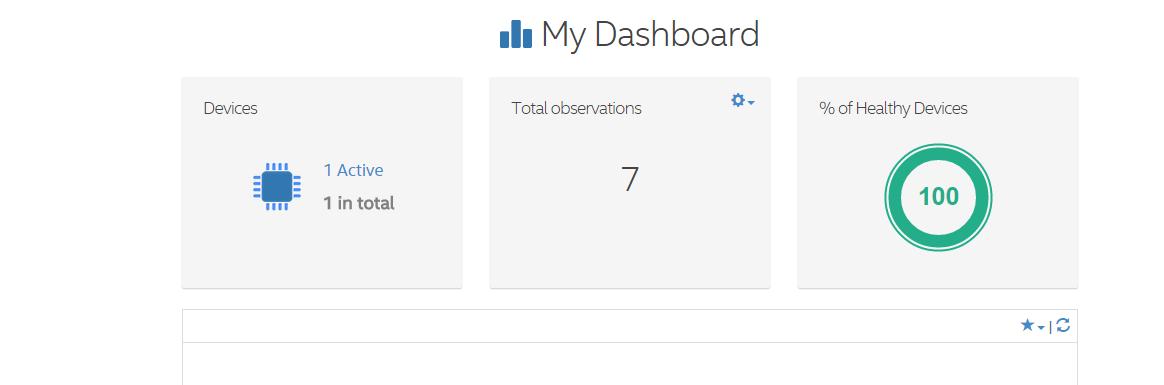
- Check Dashboard
Device 1 Activ
Last hour observation 0
Helthy 100%
that does not correct?
- Tags:
- Internet of Things
Link Copied
- Mark as New
- Bookmark
- Subscribe
- Mute
- Subscribe to RSS Feed
- Permalink
- Report Inappropriate Content
In your Dashboard you should change the Observations period to Total observations.
you can see the number!
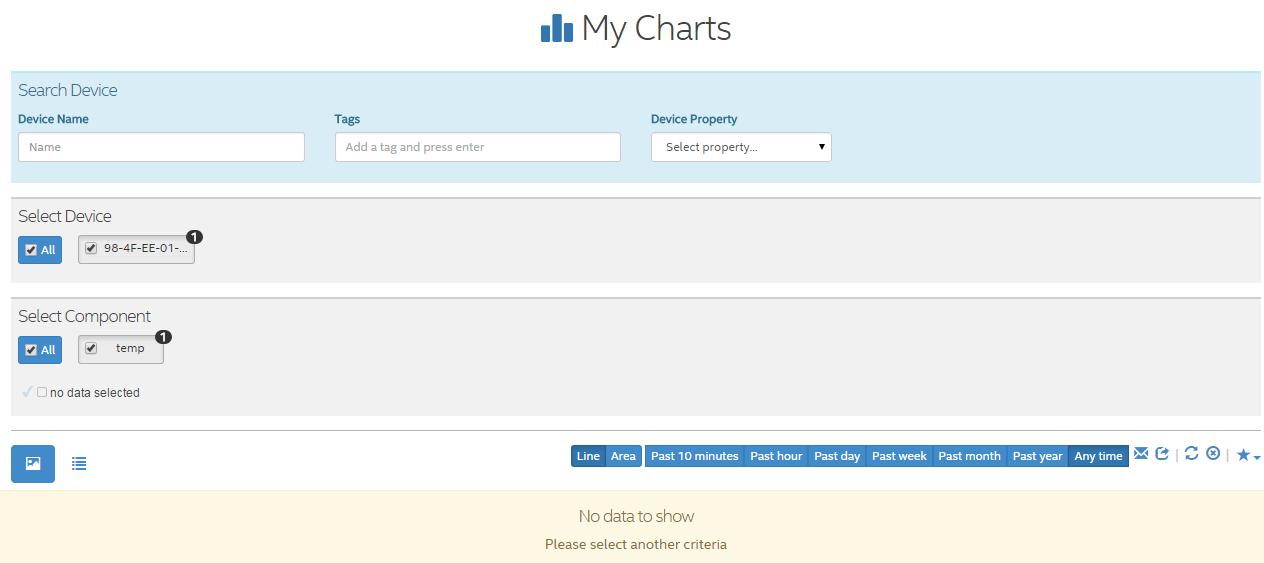
but i have a question too, i can't see any data in MY Charts, it's weird!
Can you help me about this?
Thank you!


- Mark as New
- Bookmark
- Subscribe
- Mute
- Subscribe to RSS Feed
- Permalink
- Report Inappropriate Content
Thank You Yizhuo G.
You are correct! Time not synchronised, and observation was saved to past time.
- Mark as New
- Bookmark
- Subscribe
- Mute
- Subscribe to RSS Feed
- Permalink
- Report Inappropriate Content
Healthy devices: device is healthy when it submitted data in health time period (this period is account specific, by default it’s 1 day).
Observation counter:
- It shows submitted observation count by timestamp of data
- If you change the period for observation counter to ‘all time’, you should see observation submitted for >1 year ago.
- This is implemented this way to enable submission of past data for analysis
Please verify if you can see this data on the chart if you select ‘all time’ period.
- Mark as New
- Bookmark
- Subscribe
- Mute
- Subscribe to RSS Feed
- Permalink
- Report Inappropriate Content
also note the time skew:
2014-09-04 on your device vs end of Nov on the dashboard. I.E. the sensor data might appear 2 months earlier on your chart
- Mark as New
- Bookmark
- Subscribe
- Mute
- Subscribe to RSS Feed
- Permalink
- Report Inappropriate Content
Yizhuo G. wrote:
In your Dashboard you should change the Observations period to Total observations.
you can see the number!
but i have a question too, i can't see any data in MY Charts, it's weird!
Can you help me about this?
Thank you!
we changed the time period to past year , its working for us and showing the graphs.
try it
- Subscribe to RSS Feed
- Mark Topic as New
- Mark Topic as Read
- Float this Topic for Current User
- Bookmark
- Subscribe
- Printer Friendly Page