- Mark as New
- Bookmark
- Subscribe
- Mute
- Subscribe to RSS Feed
- Permalink
- Report Inappropriate Content
Hello
Does anyone know how to read intel "uncore events" by perf tools?
I used to exploit some commands to read core's performance counters like below.
- perf stat -e cpu/event=0xd3,umask=0x01/pp <command>
But, I am sure how to read uncore events such as Ingress_occupancy on CHA.
when I try to a command like below, it doesn't work well..
- perf state -e uncore_cha_0/event=0x11,umask=0x01 <command>
Note that I am using Knights Landing machine.
Is there any idea?
Sincerely,
Thank you.
Link Copied
- Mark as New
- Bookmark
- Subscribe
- Mute
- Subscribe to RSS Feed
- Permalink
- Report Inappropriate Content
The following command worked for me:
perf stat -a -e uncore_cha_0/event=0x11,umask=0x1/
- Mark as New
- Bookmark
- Subscribe
- Mute
- Subscribe to RSS Feed
- Permalink
- Report Inappropriate Content
Dear Dmitry,
Could you let me know which machine, kernel, perf version you tested on?
In my case, I used Intel's KNL, Linux knl 3.10.0-327.13.1.el7.xppsl_1.4.0.3211.x86_64, and perf version 3.10.0-327.el7.x86_64.debug. I received the "not supported" message.
Please check the following results.
Performance counter stats for 'ls':
<not supported> uncore_cha_0/event=0x11,umask=01/
0.009539475 seconds time elapsed
Thank you.
Daejin.
- Mark as New
- Bookmark
- Subscribe
- Mute
- Subscribe to RSS Feed
- Permalink
- Report Inappropriate Content
I also got the "<not supported>" message on 3.10.0-327.22.2.el7.xppsl_1.4.1.3272.x86_64, but this morning when I tried it again I got a much better error message pointing to "perf_event_paranoid" permissions.
Sure enough, I see that /proc/sys/kernel/perf_event_paranoid is set to 1, and setting it to zero allows the "perf stat" command above to succeed. Running STREAM on 68 cores gave non-zero counts:
1,130,452,502 uncore_cha_0/event=0x11,umask=0x1/
0.440644400 seconds time elapsed
- Mark as New
- Bookmark
- Subscribe
- Mute
- Subscribe to RSS Feed
- Permalink
- Report Inappropriate Content
Dear Dr. John
Thank you for your response.
I updated my kernel version to 3.10.0-327.36.1.el7.xppsl_1.4.2.3331.x86_64 on my KNL CPU 7250. and set /proc/sys/kernel/perf_event_paranoid to zero. However, I still got the <not supported> message for uncore_cha_0/event=0x11,umask=0x01/
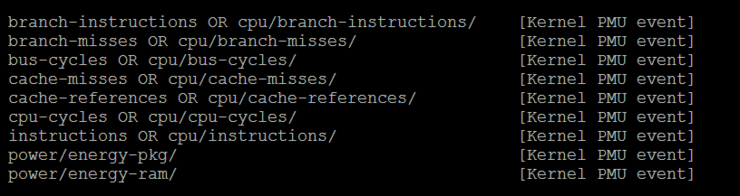
When I see the Kernel PMU event listed from "perf list" , there are not any unocre events. (my perf version is 3.10.0-327.36.2.el7.x86_64.debug )
Do you have any suggestions? Please let me know your perf version.
- Mark as New
- Bookmark
- Subscribe
- Mute
- Subscribe to RSS Feed
- Permalink
- Report Inappropriate Content
Dear Dr John and Dmitry.
I did it. I extracted occupancy counters thanks to you.
But, I'd like to set a certain threshold to get event counts whenever the occupancy exceeds the threshold. is it possible on perf?
Thank you.
Daejin Jung.
- Mark as New
- Bookmark
- Subscribe
- Mute
- Subscribe to RSS Feed
- Permalink
- Report Inappropriate Content
Please try adding 'thresh' option, e.g.:
uncore_cha_0/event=0x11,umask=0x1,thresh=0x2/
- Subscribe to RSS Feed
- Mark Topic as New
- Mark Topic as Read
- Float this Topic for Current User
- Bookmark
- Subscribe
- Printer Friendly Page