Software Tuning, Performance Optimization & Platform Monitoring
Discussion regarding monitoring and software tuning methodologies, Performance Monitoring Unit (PMU) of Intel microprocessors, and platform updating.
1711 Discussions

Memory Latency Checker Measurement Results are Different in Different NUMA Nodes

pudding_art
Beginner
558 Views

The test environment uses dual-channel Intel(R) Xeon(R) Silver 4410Y, turns on NUMA, and the configuration is as follows:

Each CPU has 12 physical cores and each physical core has 2 hyper-threads;

Clock frequency: 2.10GHz

L1 dcache: 1.1 MB

L1 icache: 768 KB

L2 cache: 48MB

L3 cache: 60MB

Local DDR Memory Type: DDR5-4800, Sumsung;

Local CXL Memory Type: DDR4-3200, Micron;

Local DDR Memory Channel: 8

Local CXL Memory Channel: 2

Local DDR Memory Size: 32Gx8 per channel, 1 on each channel

Local CXL Memory Size: Single channel 16G, only 1 memory module, single channel

The software environment configuration is as follows:

OS: Linux 6.15.4

GCC: 11.4.0

2 issues I discovered while testing my current server using MLC:

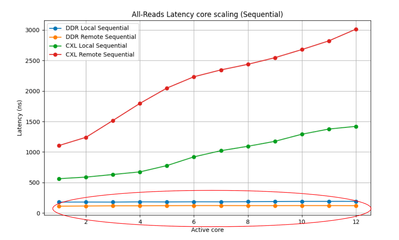
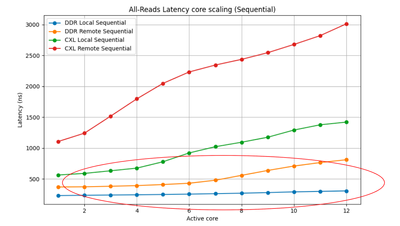
Question 1: When the CPU on the NUMA0 node accesses the DDR memory on the NUMA1 node, as the number of parallel threads increases, the bandwidth gradually increases to the bottleneck, and the delay also increases; but conversely, the CPU on the NUMA1 node accesses the DDR memory on the NUMA0 node. When using DDR memory, the bandwidth increases to the bottleneck, but the latency does not change significantly, with a very small increase. The scripts used are the same except that the bound CPU and memory are on different NUMA nodes. What may be the reason for this?

Question 2: Is the latency of the CPU on the NUMA1 node accessing local memory higher than Remote DDR?

The monitoring tool shows that there is no problem with the binding of CPU and memory. The principle of MLC delay test is to create a timer at the beginning of the test, then continuously execute the load instruction to access the memory of the specified size, and record the number of load instructions run during this stage and the total running time. 

pudding_art_0-1710054890617.png

pudding_art_1-1710054898657.png


The test script for CPU binding on the NUMA1 node is as follows:

#!/bin/bash
 
MLC="./mlc" # MLC command
NUMA="numactl"
OPERATION="R" # Read-only as default
DRATION=5 # Run 5 seconds as default
LOW=12
BUFFER=200000
 
function memorybw_core()
{
core_count=$1
MEM_BIND=$2
 
mask=0x$(echo "obase=16;2^(${core_count}+1)-2^${LOW}" | bc)
 
bw=$($NUMA -m${MEM_BIND} ${MLC} --loaded_latency -d0 -${OPERATION} -b${BUFFER} -t${DRATION} -m$mask | grep 00000 | awk '{print $2, $3}' >> numa1cpu_latency.txt)
echo $bw
}

for MEM_BIND in {0..2}
do
echo "Memory loc in NUMA${MEM_BIND}"
echo "NUMA ${MEM_BIND}" >> numa1cpu_latency_bw.txt
for i in {12..23}
do
bw=$(memorybw_core $i ${MEM_BIND})
echo "#$i done!"
done
done


The test script for CPU binding on the NUMA0 node is as follows:

#!/bin/bash

MLC="./mlc" # MLC command
OPERATION="R" # Read-only as default
DRATION=5 # Run 5 seconds as default
BUFFER=200000


function memorybw_core()
{
core_count=$1
 
mask=0x$(echo "obase=16;2^${core_count}-1" | bc)
bw=$(${MLC} --loaded_latency -d0 -${OPERATION} -b${BUFFER} -t${DRATION} -m$mask | grep 00000 | awk '{print $2, $3}' >> numa0cpu_latency_bw.txt)
# -d : Specify load injection delay. A value of 0 for -d may provide maximum throughput.
# OPERATION: read-write ratio
# -t : Set time in seconds during which each measurement is captured.
# -T : Specify this flag if only b/w is desired without latency values.
# -m : Specify the mask value (in hex) of CPUs to run the bandwidth generation threads.CPU0 should be excluded from this mask \
# as it is used to run the latency measuring thread. If Intel Hyper Threading Technology is enabled, the other CPU that is part\
# of physical core 0 should also be ommitted from this mask.


echo $bw
}


function get_core_counts()
{
# total physical cores number
skt=$(lscpu|grep "Socket(s)" | awk -F: '{print $2}')
cps=$(lscpu|grep "Core(s) per socket" | awk -F: '{print $2}')
 
echo $(($skt*$cps)) # sockets x cores per socket
}

function get_single_core_counts()
{
echo $(lscpu|grep "Core(s) per socket" | awk -F: '{print $2}')
 
}

for MEM_BIND in {0..2}
do
echo "Memory loc in NUMA${MEM_BIND}"
echo "NUMA${MEM_BIND}" >> numa0cpu_latency_bw.txt
for i in $(seq 1 $(get_single_core_counts))
do
bw=$(memorybw_core $i $MEM_BIND)
echo "#$i done!"
done
done


What is the reason for this phenomenon? Is there a problem with my test script or do I not understand the principles of MLC testing? Please reply as soon as possible.

0 Kudos
0 Replies
Reply