- Mark as New
- Bookmark
- Subscribe
- Mute
- Subscribe to RSS Feed
- Permalink
- Report Inappropriate Content
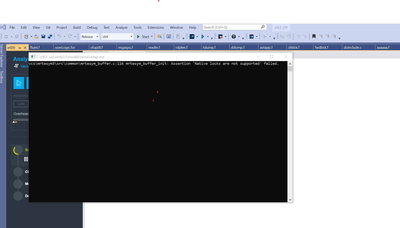
I get the message shown in the picture. It only flashes on the screen for a second so it took some work to capture. Any way to get that window to stay open when there is a failure?
And what can I do about the message. it seems to come from advisor code.
Link Copied
- Mark as New
- Bookmark
- Subscribe
- Mute
- Subscribe to RSS Feed
- Permalink
- Report Inappropriate Content
I got past the above error and now I see this in the suitablity log.
Collection status has changed. 1
Collection has been started.
Assertion failed: thread_manager_impl:485: (blocked == tpss_tls_op_err_ok) : . Please contact the technical support.
Collection has stopped. Application exit code: -2147483645
Loading cached program model
Is this technical support?
- Mark as New
- Bookmark
- Subscribe
- Mute
- Subscribe to RSS Feed
- Permalink
- Report Inappropriate Content
Thank you for posting in Intel Forums.
We would like to have some additional information from your side to resolve this issue further.
1) Intel Advisor version
2) Reproducer and steps, you followed.
We were able to open the result from our end but unable to see the error.
Regards
Abhijeet
- Mark as New
- Bookmark
- Subscribe
- Mute
- Subscribe to RSS Feed
- Permalink
- Report Inappropriate Content
Intel Advisor 2021.4 Simple projects seem to work fine, it fails to work on our commercial code. Making a reproducer without providing all of our software will be difficult at best, and most likely impossible. So it may take some time to find a way to do this.
- Mark as New
- Bookmark
- Subscribe
- Mute
- Subscribe to RSS Feed
- Permalink
- Report Inappropriate Content
So I have updated to the latest version by installing oneAPI 2022.1 and HPCToolkit 2022.1 (why is the ifort compiler 2021.5?).
So I recompiled everything and ran in advisor. The suitability tests gives this in the output window.
Data collection processing end
Finalization time: 08s
Collection status has changed. 1
Collection has been started.
Collection has stopped. Application exit code: 0
Collection time: 05s
Loading cached program model
Cache load failed
Loading collected suitability data
Finalizing results
Finalizing the result
Clearing the database
The database has been cleared, elapsed time is 0.294 seconds.
Loading raw data to the database
Loading 'systemcollector-25688-DESKTOP-KFFJHJS.sc' file
Loading '19684-27132.0.trace' file
Loading 'userapicollector-27132-0d533aec.trace' file
Updating precomputed scalar metrics
Raw data has been loaded to the database, elapsed time is 0.194 seconds.
Processing profile metrics and debug information
Processing GPU time information
Data transformations have been finished, elapsed time is 0.032 seconds.
Setting data model parameters
Resolving module symbols
Resolving information for `ucrtbase.dll'
Resolving information for `libiomp5md.dll'
Resolving information for `ittnotify_collector.dll'
Resolving information for `astap.exe'
Warning: Cannot locate debugging information for file `C:\Windows\System32\ucrtbase.dll'.
Warning: Cannot locate debugging information for file `C:\Program Files (x86)\Intel\oneAPI\advisor\2022.0.0\bin64\runtime\ittnotify_collector.dll'.
Resolving bottom user stack information
Resolving thread name information
Resolving call target names for dynamic code
Symbol resolution has been finished, elapsed time is 6.054 seconds.
Processing profile metrics and debug information
Error: Error 0x40000024 (No data) -- No data is collected. Possible reasons:
- Workload is too small. No samples are collected.
- The application environment is not specified correctly.
- The executable file has been stripped so cannot be profiled with algorithm analysis types.
See the Troubleshooting help topic for more details.
Also consider checking the collection log for additional information.
Processing GPU time information
Deferred data transformations have been finished, elapsed time is 0.026 seconds.
Setting data model parameters
Data model parameters have been set, elapsed time is 0.078 seconds.
Precomputing frequently used data
Precomputing frequently used data
Updating precomputed scalar metrics
Precomputing frequently used data has been finished, elapsed time is 0.041 seconds.
Discarding redundant overtime data
Saving the result
Redundant overtime data has been discarded, elapsed time is 0.025 seconds.
Raw collector data has been discarded, elapsed time is 0.000 seconds.
Finalizing the result took 7.114 seconds.
Resolving module symbols
Resolving information for dangling locations
Resolving bottom user stack information
Resolving thread name information
Resolving call target names for dynamic code
Precomputing frequently used data
Saving the result
Saving program model
Caching program model
Compressing the model
Compressing the model
Preparing data for efficient display
Data collection processing end
Finalization time: 08s
Since I ran the suitability test again to get some information the log windows are messed up. This is what appears when I click on the Collection log link in the summary window. In fact all the tabs in the window show this same text. I have to exit VS and reload to
Looks like the command line. So something in the interface has been corrupted.
But I don't understand why it can't collect data for the analysis. It takes .31 seconds to run the code here:
CALL TDERIV(MODNO,0,.FALSE.,.TRUE.,.TRUE.)
call annotate_site_begin("DERIVS")
call start_ti
call print_ti
DO 100 LL = 1,NUMTNK(MODNO)
call annotate_iteration_task("lumpDerivs")
L = PNTTNK(MODNO) + LL - 1
IF(LMPSTA(L) .EQ. 4 .OR. LTYPE(L) .EQ. -2)GOTO 100
IF(LMPSTA(L) .EQ. 1) THEN
DPDVUM(L) = 0.0
DHDVUM(L) = 0.0
GOTO 100
ENDIF
LMPERR = L
IF(LTYPE(L) .GT. 0)THEN
CALL TNKHDI(L,DRDUI,DHDUPI,DHDPUI,MODNO)
CALL TNKHDE(L,DRDUI,DHDUPI,DHDPUI,MODNO)
ELSEIF(LTYPE(L) .EQ. -1)THEN
CALL TNKSDI(L,MODNO,FI(LOCFLD(MODNO)))
ENDIF
100 CONTINUE
call print_ti
CALL annotate_site_end
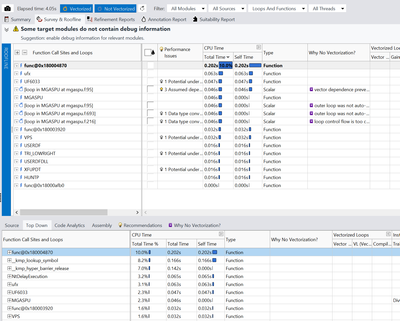
The executable takes 2 seconds to run overall. This seems consistent with some of the numbers here:
But I don't understand why it isn't listing all of the routines in the annotated section.
I don't know what I can do for these reasons given for no data collection. Can you provide specific instructions?
- The application environment is not specified correctly.
- The executable file has been stripped so cannot be profiled with algorithm analysis types.
I can't upload all the necessary source here as it is proprietary, and reducing this down to a much smaller set of sources wouldn't be possible. I'd be happy to do a screen share session if you want to look at it that way. Provide some hours that work and I can set up a session. I'm available 6am Mountain Time to 5pm and in the evenings some days.
Dave
- Mark as New
- Bookmark
- Subscribe
- Mute
- Subscribe to RSS Feed
- Permalink
- Report Inappropriate Content
Abhijeet,
How do I reply to a private message? Yes I have priority support.
Dave
- Mark as New
- Bookmark
- Subscribe
- Mute
- Subscribe to RSS Feed
- Permalink
- Report Inappropriate Content
Hi,
Thanks for confirming.
Could you please check with the priority support here https://www.intel.com/content/www/us/en/developer/get-help/priority-support.html
or
https://supporttickets.intel.com/?lang=en-US
Regards
Abhijeet
- Mark as New
- Bookmark
- Subscribe
- Mute
- Subscribe to RSS Feed
- Permalink
- Report Inappropriate Content
Abhijeet,
Please provide an answer on how to respond to a private message. Slow responses are bad. Completely ignoring questions is horrible customer service.
Dave
- Mark as New
- Bookmark
- Subscribe
- Mute
- Subscribe to RSS Feed
- Permalink
- Report Inappropriate Content
Hi,
Please follow below steps to respond to a private message:
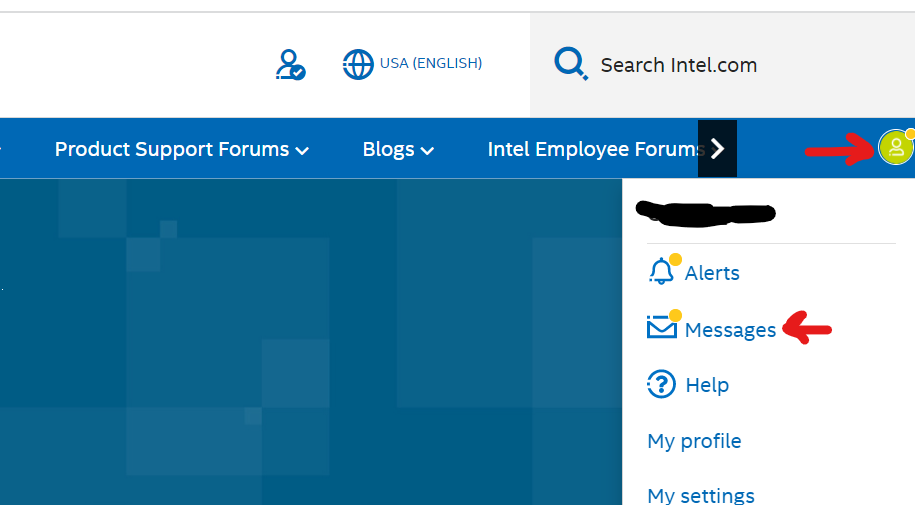
1. While logged in to your Intel community account, on the top right corner of the community page you can see an icon as shown in the image below.
2. On clicking the icon, you will see your username followed by a list.
From the list please select the messages tab.
3. On clicking on the messages, it will redirect you to inbox.
You will see all your messages here and you can reply from here.
Since you have a priority support you can avail it from the given below link to get better service.
Priority support: https://www.intel.com/content/www/us/en/developer/get-help/priority-support.html
https://supporttickets.intel.com/?lang=en-US
Thanks
Abhijeet
- Mark as New
- Bookmark
- Subscribe
- Mute
- Subscribe to RSS Feed
- Permalink
- Report Inappropriate Content
Hi,
Could you please give us an update? Have you checked with priority support?
Also could you please let us know if we can close this thread?
Regards
- Mark as New
- Bookmark
- Subscribe
- Mute
- Subscribe to RSS Feed
- Permalink
- Report Inappropriate Content
I submitted case# 05310870 on 12/14/2020 and have yet to receive a reply. Can you tell me why I haven't gotten a response yet?
Dave
- Mark as New
- Bookmark
- Subscribe
- Mute
- Subscribe to RSS Feed
- Permalink
- Report Inappropriate Content
Hi,
We did not receive any priority support ticket from you in https://supporttickets.intel.com/?lang=en-US .
The case# 05310870 which you shared is the community case in which we are interacting.
As you are eligible for priority support, request you to raise a new ticket in https://supporttickets.intel.com/?lang=en-US to get better support.
Regards
- Mark as New
- Bookmark
- Subscribe
- Mute
- Subscribe to RSS Feed
- Permalink
- Report Inappropriate Content
Hi,
We assume that you reached out to the priority support and got the required support.
If you need any additional information, please post a new priority ticket as this thread will no longer be monitored by Intel.
Regards
Abhijeet
- Subscribe to RSS Feed
- Mark Topic as New
- Mark Topic as Read
- Float this Topic for Current User
- Bookmark
- Subscribe
- Printer Friendly Page


