- Mark as New
- Bookmark
- Subscribe
- Mute
- Subscribe to RSS Feed
- Permalink
- Report Inappropriate Content
Hi,
I am analyzing the different between two designs which process millions of messages. One design uses polymorphism and the other doesnt- each message will be represented by a polymorphic sub type.
I have profiled both designs using VTune. The High-level summary data seems to make sense- the polymorphic design has a higher "branch mispredict" rate, higher CPI and higher "ICache misses" rate than the non-polymorphic version implemented with IF statements.
The polymorphic design has a line of source code like this:
object->virtualFunction();
and this is called millions of times (where the sub type changes each time). I am expecting the polymorphic design to be slower because of branch target mispredictions/instruction misses. As said above, the VTune "summary" tab seems to confirm this. However, when I go to the metrics next to the line of source code there are absolutely no metrics except for:
- Filled pipeline slots total -> Retiring -> General retirement
- Filled pipeline slots self -> Retiring -> General retirement
- Unfilled pipeline slots total -> Front end bound -> Front end bandwidth -> Front end bandwidth MITE
- Unfilled pipeline slots self -> Front end bound -> Front end bandwidth -> Front end bandwidth MITE
None of the branch prediction columns have data, nor do the instruction cache miss columns??
Could somebody please comment on whether this seems sensible? To me it doesn't- how can there be no branch misprediction or instruction cache miss statistics for a line of polymorphic code where the branch target will constantly be changing per message?
Link Copied
- Mark as New
- Bookmark
- Subscribe
- Mute
- Subscribe to RSS Feed
- Permalink
- Report Inappropriate Content
Thanks Peter.
Seems that I was looking in wrong place.Today I will rerun the test.
- Mark as New
- Bookmark
- Subscribe
- Mute
- Subscribe to RSS Feed
- Permalink
- Report Inappropriate Content
Hi Peter,
I think we may be getting somewhere. I have version 13 but I see different results. Let me summarize the attachments I am including:
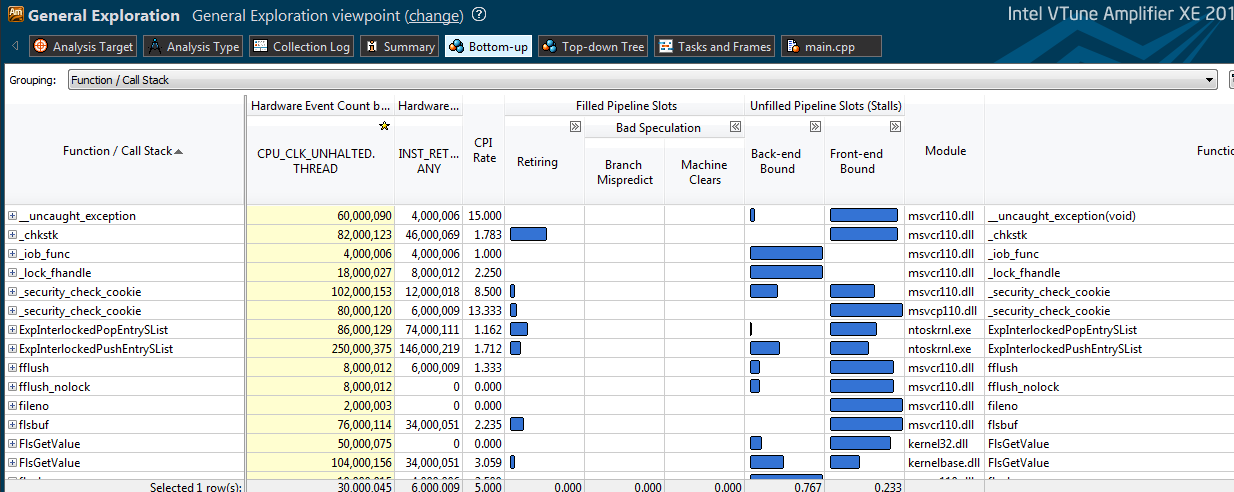
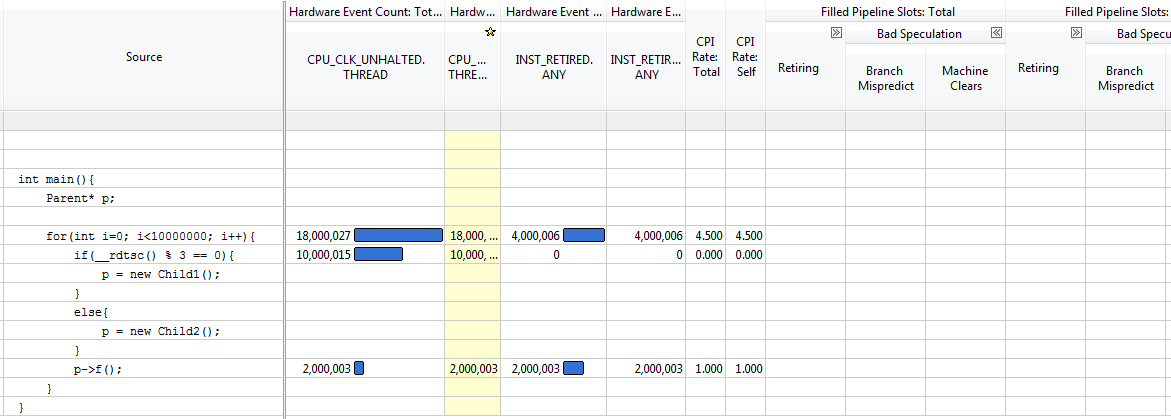
-In the source code view of main() I have nothing in either of the two Branch Mispredict columns
-In bottom-up view I have sorted by branch mispredict. Main doesn't have a mispredict and child1::f() doesnt even appear in the list:
Confirming Child1::f() doesn't appear in the list of functions:
One of the points to highlight- it seems you see different columns than me. For example I can not directly see anything labelled BP_INST_RETIRED.ALL_BRANCHES
At least we're making progress though- it seems I have a different GUI view to yourself?
- Mark as New
- Bookmark
- Subscribe
- Mute
- Subscribe to RSS Feed
- Permalink
- Report Inappropriate Content
I am using version 15 of VTune XE 2013
- Mark as New
- Bookmark
- Subscribe
- Mute
- Subscribe to RSS Feed
- Permalink
- Report Inappropriate Content
@T C
I cannot see your screenshots.
- Mark as New
- Bookmark
- Subscribe
- Mute
- Subscribe to RSS Feed
- Permalink
- Report Inappropriate Content
iliyapolak wrote:
@T C
I cannot see your screenshots.
Are you on a mobile device? I am on Chrome (on a PC) and they show fine?
- Mark as New
- Bookmark
- Subscribe
- Mute
- Subscribe to RSS Feed
- Permalink
- Report Inappropriate Content
No I am using now IE10.
- Mark as New
- Bookmark
- Subscribe
- Mute
- Subscribe to RSS Feed
- Permalink
- Report Inappropriate Content
Sorry I never saw the attachment facility. I have attached the 3 screen captures here too.
Intel1.png- shows the source code view.
- I do not have a column representing BP_INST_RETIRED.ALL_BRANCHES
- I do not have any metrics for either "Branch mispredict"
Intel2.png shows that I do not have Child1::f() in my results (I sorted the results based on the function name)
Intel3.png shows the results sorted by branch misprediction. main() does not have any branch mispredictions (confirming intel1.png)
- Mark as New
- Bookmark
- Subscribe
- Mute
- Subscribe to RSS Feed
- Permalink
- Report Inappropriate Content
I had very similar results.Only C runtime library code and ntoskrnl code both had its branch misprediction measured.
- Mark as New
- Bookmark
- Subscribe
- Mute
- Subscribe to RSS Feed
- Permalink
- Report Inappropriate Content
I tested code under Linux. Interesting thing is - 1) I can see Branch Misprediction data on Nehalem processor ("main" function, I posted yesterday). However 2) I had similar result on SandyBridge processor & IvyBridge processor - no Branch Misprediction on "main" function.
Was it due to I-Cache & BTB enhanced on SandyBridge & IvyBridge?
- Mark as New
- Bookmark
- Subscribe
- Mute
- Subscribe to RSS Feed
- Permalink
- Report Inappropriate Content
@Peter
I tested that code compiled by Intel compiler on Windows 8.Could this be a reason for not displaying branch misprediction data?
- Mark as New
- Bookmark
- Subscribe
- Mute
- Subscribe to RSS Feed
- Permalink
- Report Inappropriate Content
I am not sure if CPU could completely predict branch which is based on the outcome of rdtsc instruction and modulo division.I suppose that for loop is predictable because of backward conditional jump.
- Mark as New
- Bookmark
- Subscribe
- Mute
- Subscribe to RSS Feed
- Permalink
- Report Inappropriate Content
I remember that Sandy/Ivy bridge CPUs cannot run the branch analysis (as opposed to General Analysis). However, I didnt think they were prevented from the normal branch analysis done within the general analysis!?
Peter I asked a similar question a month or so ago and was told VTune can do branch misprediction on Ivy Bridge:
http://software.intel.com/comment/1778869
No, you can measure cache misses and branch mispredictions. Use "General Exploration" analysis - it is a combination of many metrics, including those you're looking for.
Peter, would you be able to escalate this/find an official answer, because it seems odd that the Intel profiler cannot measure branch misprediction on the latest Ivy Bridge and Haswell CPUs..... and if this is the case I am in big trouble........
- Mark as New
- Bookmark
- Subscribe
- Mute
- Subscribe to RSS Feed
- Permalink
- Report Inappropriate Content
iliyapolak wrote:
I am not sure if CPU could completely predict branch which is based on the outcome of rdtsc instruction and modulo division.I suppose that for loop is predictable because of backward conditional jump.
CPUs can, its called branch target prediction and it uses a branch target buffer:
http://en.wikipedia.org/wiki/Branch_target_predictor
Also see Agner Fog booklet:
- Mark as New
- Bookmark
- Subscribe
- Mute
- Subscribe to RSS Feed
- Permalink
- Report Inappropriate Content
I should have written about the probability of the prediction of the first encountered branch based on rdtsc instruction and modulo division in instruction cache.
- Mark as New
- Bookmark
- Subscribe
- Mute
- Subscribe to RSS Feed
- Permalink
- Report Inappropriate Content
iliyapolak wrote:
I should have written about the probability of the prediction of the first encountered branch based on rdtsc instruction and modulo division in instruction cache.
My point was that it will TRY and predict- whether this is correct or not doesn't really matter. I was expecting VTune to be able to tell me what ratio were mispredicted. I am 99% certain VTune reports this for Sandy Bridge.
Hopefully the Ivy Bridge CPUs aren't missing the registers used for sampling the branch performance- because then its just a case of an update to the VTune software....
- Mark as New
- Bookmark
- Subscribe
- Mute
- Subscribe to RSS Feed
- Permalink
- Report Inappropriate Content
>>>Hopefully the Ivy Bridge CPUs aren't missing the registers used for sampling the branch performance- because then its just a case of an update to the VTune software.>>>
I hope that SDM has an info about those MSR registers on specific architectures,but I am lazy to check it now:)
- Mark as New
- Bookmark
- Subscribe
- Mute
- Subscribe to RSS Feed
- Permalink
- Report Inappropriate Content
OK. I have escalated a new ticket to our engineering for official answer.
Subject: Analyzing overhead of polymorphic code- no branching metrics available?
Context:
The polymorphic design has a line of source code like object->virtualFunction() and this is called millions of times (see attached test code), we suppose it has branch and hope to see Branch Misprediction metric data in VTune report by using general-exploration analysis. We used Intel C/C++ Composer XE 2013 SP1 to build (see attached binary), we can see expected result (r001ge) on Nehalem processor, can't see Branch Misprediction metric data in result (r003ge) on IvyBridge (either SandyBridge) processor. Note that I copied binary to IvyBridge without rebuilding.
I attached screenshots on Nehalem, you can see expected result from Nehalem...
The questions are:
1. Is it possible that SandBridge/IvyBridge have more BTB entries - so there is no Branch Misprediction detetcted? Microarchitecture enhanced?
2. Is it possible that Branch Misprediction happens but VTune hasn't detected it? I mean VTune's bug?
-----------------------------------------------------------------------------------------------------------------------------------------
I will update any answer from developer, soon...
Thanks, Peter
- Mark as New
- Bookmark
- Subscribe
- Mute
- Subscribe to RSS Feed
- Permalink
- Report Inappropriate Content
Thanks Peter.
Can you comment on why your GUI looks different to mine? You had the BP_INST_RETIRED.ALL_BRANCHES column. We are both using update 15 of VTune XE 2013? I wonder if the GUI detects what CPU is running and adjusts the GUI layout accordingly?!
- Mark as New
- Bookmark
- Subscribe
- Mute
- Subscribe to RSS Feed
- Permalink
- Report Inappropriate Content
@ TC
My column is "Branch Misprediction" and I worked on Linux, VTune Amplifier XE 2013 Update 15
- Mark as New
- Bookmark
- Subscribe
- Mute
- Subscribe to RSS Feed
- Permalink
- Report Inappropriate Content
Peter Wang (Intel) wrote:
@ TC
My column is "Branch Misprediction" and I worked on Linux, VTune Amplifier XE 2013 Update 15
Hi Peter,
In the attachment (the one you originally added) you have the BP_INST_RETIRED.ALL_BRANCHES column whereas I do not?
So not only am I missing the actual data for measuring the branch mispredictions, I am also missing this BP_INST_RETIRED.ALL_BRANCHES-labelled column.
- Mark as New
- Bookmark
- Subscribe
- Mute
- Subscribe to RSS Feed
- Permalink
- Report Inappropriate Content
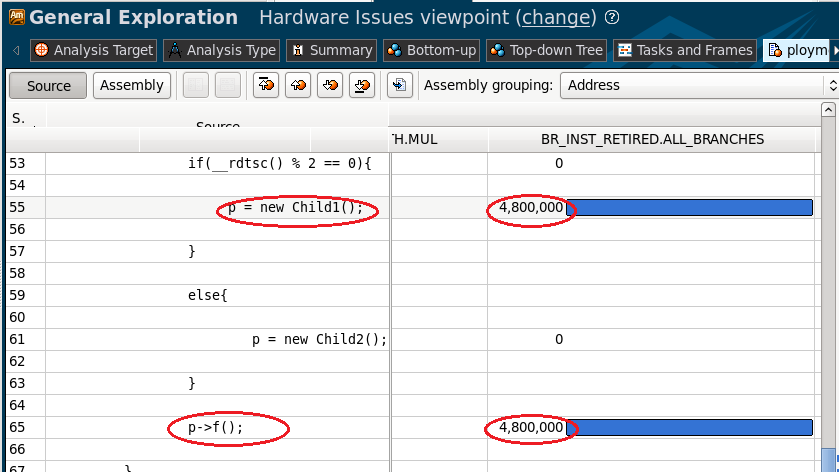
Column "Branch Mispredict" is showed in bottom-up report. Column "BR_INST_RETIRED.ALL_BRANCHES" is showed in source view report. I'm using Update 15.
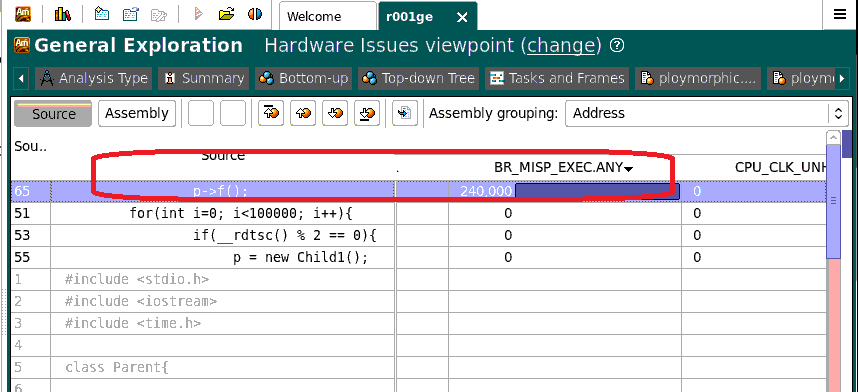
First one is metric, and second one is event - sorry that I have to show your event BR_MISP_EXEC.ANY - see attached screen-shot, all branch misprediction at line 65: p->f();
- Subscribe to RSS Feed
- Mark Topic as New
- Mark Topic as Read
- Float this Topic for Current User
- Bookmark
- Subscribe
- Printer Friendly Page