- Mark as New
- Bookmark
- Subscribe
- Mute
- Subscribe to RSS Feed
- Permalink
- Report Inappropriate Content
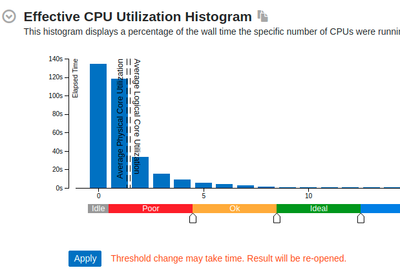
I'm trying to calculate how much "wall time" each function spends in my application. However, vTune does not seem to report that metric on a per-function basis in its reports, and the closest approximation that I can use is this 5-tier categorized "effective CPU time by Utilization" metric that is presented in the hotspot report.
My analysis involves generating hotspot reports for a great number of application runs, therefore I found the CLI very useful. I did not, however, find a way to modify in CLI the threshold value that demarcates the five tiers (Idle, Poor, Ok, Ideal, Over); and the only way to modify these thresholds is to go into the GUI, manually drag the bars to change the threshold.
Could it be possible that the development team add a CLI option that sets the threshold values for demarcating the five tiers of CPU utilization? Or possibly make vTune calculate a "wall time" metric for each function?
Link Copied
- Mark as New
- Bookmark
- Subscribe
- Mute
- Subscribe to RSS Feed
- Permalink
- Report Inappropriate Content
My OS version: Ubuntu 20.04.3 LTS
Tool version: vTune standalone 2021.5
- Mark as New
- Bookmark
- Subscribe
- Mute
- Subscribe to RSS Feed
- Permalink
- Report Inappropriate Content
After some text searching I believe one (hackful) way to do this is:
1. Add the following configuration (marked in bold) to <project_name>.vtuneproj. The values highlighted in red are the threshold values for CPU utilization that I want to configure
<root>
<!--Other auto-generated configurations-->
<engine>
<knobs>
<utilizationThreshold type="string">
<bag xmlns:boolean="http://www.w3.org/2001/XMLSchema#boolean" xmlns:double="http://www.intel.com/2001/XMLSchema#double" id="utilizationThreshold">
<minValueThresholds domain="">
<double:minValueThreshold name="Idle">-40 <boolean:readonly>true</boolean:readonly>
</double:minValueThreshold>
<double:minValueThreshold name="Poor">3.9999999999999998e-06 <boolean:readonly>true</boolean:readonly>
</double:minValueThreshold>
<double:minValueThreshold name="Ok">4.5 <boolean:readonly>false</boolean:readonly>
</double:minValueThreshold>
<double:minValueThreshold name="Ideal">8.5 <boolean:readonly>false</boolean:readonly>
</double:minValueThreshold>
<double:minValueThreshold name="Over">12.5 <boolean:readonly>false</boolean:readonly>
</double:minValueThreshold>
</minValueThresholds>
</bag>
</utilizationThreshold>
</knobs>
</engine>
</root>
2. Write a script where you iterate over all reports and use vtune -I to refinalize the results.
Before a CLI option comes out I think this is the only convenient way to minimize my work to change the CPU utilization threshold value for every report in a project.
- Mark as New
- Bookmark
- Subscribe
- Mute
- Subscribe to RSS Feed
- Permalink
- Report Inappropriate Content
It appears that the .vtuneproj configuration file only affects the GUI tool's behavior. If I'm calling vtune -finalize in CLI, those threshold values will not at all be picked up! So far I cannot figure out a purely CLI-based means to do what I want to do.
- Subscribe to RSS Feed
- Mark Topic as New
- Mark Topic as Read
- Float this Topic for Current User
- Bookmark
- Subscribe
- Printer Friendly Page

