- Mark as New
- Bookmark
- Subscribe
- Mute
- Subscribe to RSS Feed
- Permalink
- Report Inappropriate Content
Hey,
I am attempting to profile a threaded version of a Fortran simulation using VTune. The threading was done using OpenMP and the Intel Fortran compiler. After completing data collection I get the following error message during finalization:
Cannot load data file 'C:\Users\...\r001hs\data.0\3740-14804.0.trace' (createEventInstance: wrong uniqueTid)
This leads to inaccurate results showing wrong total wall time or wrong thread count/histogram.
I managed to do a couple of analyses before but, since this started happening, I don't seem to be able to redo them without this error. Also, I don't get this error when I profile the single thread version. I don't know where to start with troubleshooting this so any tips will be appreciated.
Software and system information:
- I am using Intel VTune Amplifier GUI 2019 Update 2 Product Build 588069. Analysis type is Hotspots and its running on my local machine. Also, I always run it as admin.
- Compiler: Intel fortran compiler 19.0 update 1 for the Visual Studio 2017 environment. I compile with the following options:
/nologo /O2 /fpp /Qopenmp /module:"Release\\" /object:"Release\\" /Fd"Release\vc150.pdb" /libs:static /threads /c /Zi /debug:inline-debug-info
- My OS is: 64 bit Windows 10 Enterprise version 10.0.17134 Build 17134.
- My processor is: Intel Core i7-7800X @ 3.50GHz with 12 Logical Processors
Regards,
Ghassan
- Mark as New
- Bookmark
- Subscribe
- Mute
- Subscribe to RSS Feed
- Permalink
- Report Inappropriate Content
Hello,
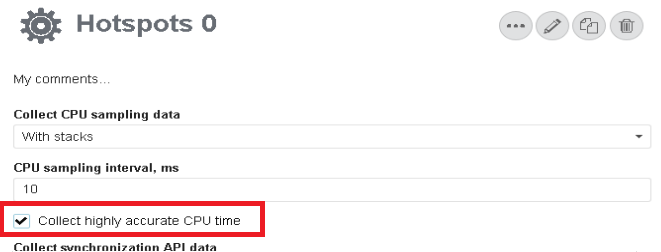
Is the "Collect highly accurate CPU time" option enabled in your VTune Analysis? Can you try to disable it and re-run the collection? - It should be possible to change it in the custom collection copied from "Hotspots"
Link Copied
- Mark as New
- Bookmark
- Subscribe
- Mute
- Subscribe to RSS Feed
- Permalink
- Report Inappropriate Content
Hello,
Is the "Collect highly accurate CPU time" option enabled in your VTune Analysis? Can you try to disable it and re-run the collection? - It should be possible to change it in the custom collection copied from "Hotspots"
- Mark as New
- Bookmark
- Subscribe
- Mute
- Subscribe to RSS Feed
- Permalink
- Report Inappropriate Content
Hello,
While the problem is being triaged you can try hotspots analysis with stacks based on HW events (if Intel SEP driver is installed and available on your system):

Thanks & Regards, Dmitry
- Mark as New
- Bookmark
- Subscribe
- Mute
- Subscribe to RSS Feed
- Permalink
- Report Inappropriate Content
Hey thanks for your replies!
I ran an analysis without the accurate CPU time option enabled and didn't encounter the error. The results are very similar to what I got before. Given this would you know how to address the problem? I might not need to but its nice to have for the record or in case this causes issues later on.
I couldn't get results with Hardware Event-Based Sampling because I have Credential Guard enabled and I couldn't disable it. I used this tool but after rebooting it was enabled again. It might be because the group policy controls this. I ignored the warning and ran anyway but I got a database error during finalization.
Regards,
Ghassan
- Subscribe to RSS Feed
- Mark Topic as New
- Mark Topic as Read
- Float this Topic for Current User
- Bookmark
- Subscribe
- Printer Friendly Page
